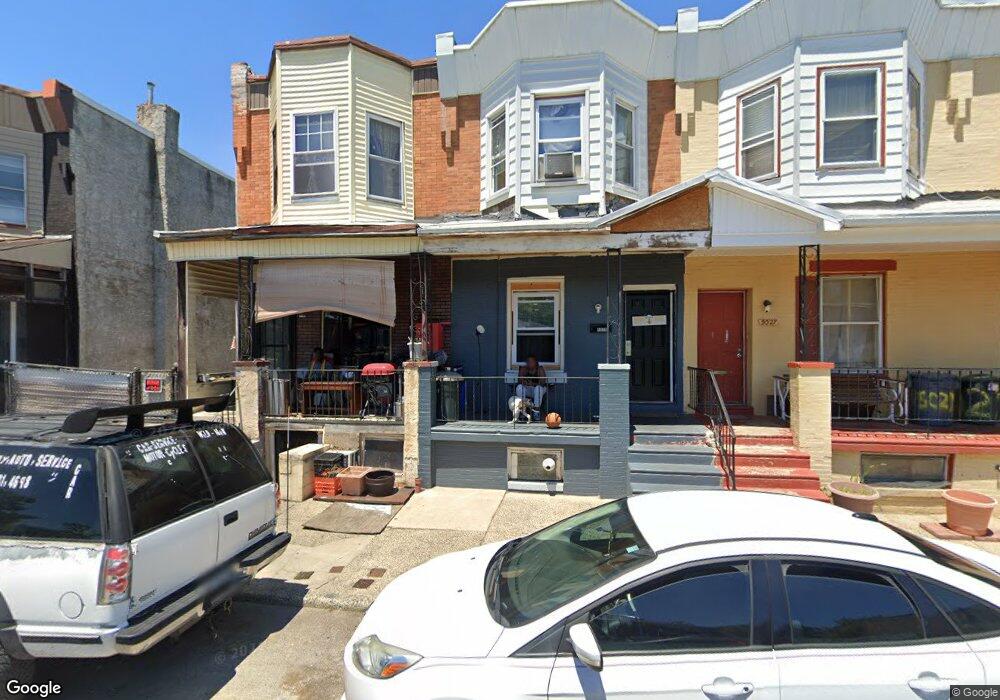
5029 Funston St Philadelphia, PA 19139
Mill Creek NeighborhoodEstimated Value: $113,015 - $140,000
3
Beds
1
Bath
1,048
Sq Ft
$123/Sq Ft
Est. Value
About This Home
This home is located at 5029 Funston St, Philadelphia, PA 19139 and is currently estimated at $129,254, approximately $123 per square foot. 5029 Funston St is a home located in Philadelphia County with nearby schools including James Rhoads Elementary School, Overbrook High School, and Quba Institute Day School.
Ownership History
Date
Name
Owned For
Owner Type
Purchase Details
Closed on
Jul 11, 2005
Sold by
Us Bank Na
Bought by
Toney David
Current Estimated Value
Purchase Details
Closed on
Jun 20, 2005
Sold by
Thompson George H and Us Bank Na
Bought by
Us Bank Na and First Bank Na
Purchase Details
Closed on
Feb 19, 1997
Sold by
Eburuoh Lawrence
Bought by
Thompson George H
Purchase Details
Closed on
May 8, 1995
Sold by
Hud
Bought by
Eburouh Lawrence
Create a Home Valuation Report for This Property
The Home Valuation Report is an in-depth analysis detailing your home's value as well as a comparison with similar homes in the area
Home Values in the Area
Average Home Value in this Area
Purchase History
| Date | Buyer | Sale Price | Title Company |
|---|---|---|---|
| Toney David | $10,000 | Independence Abstract & Titl | |
| Us Bank Na | $25,000 | -- | |
| Thompson George H | $32,000 | -- | |
| Eburouh Lawrence | $5,000 | -- |
Source: Public Records
Tax History Compared to Growth
Tax History
| Year | Tax Paid | Tax Assessment Tax Assessment Total Assessment is a certain percentage of the fair market value that is determined by local assessors to be the total taxable value of land and additions on the property. | Land | Improvement |
|---|---|---|---|---|
| 2025 | $890 | $85,200 | $17,040 | $68,160 |
| 2024 | $890 | $85,200 | $17,040 | $68,160 |
| 2023 | $890 | $63,600 | $12,720 | $50,880 |
| 2022 | $715 | $63,600 | $12,720 | $50,880 |
| 2021 | $715 | $0 | $0 | $0 |
| 2020 | $715 | $0 | $0 | $0 |
| 2019 | $689 | $0 | $0 | $0 |
| 2018 | $633 | $0 | $0 | $0 |
| 2017 | $633 | $0 | $0 | $0 |
| 2016 | $633 | $0 | $0 | $0 |
| 2015 | $619 | $0 | $0 | $0 |
| 2014 | -- | $46,200 | $2,921 | $43,279 |
| 2012 | -- | $4,640 | $535 | $4,105 |
Source: Public Records
Map
Nearby Homes