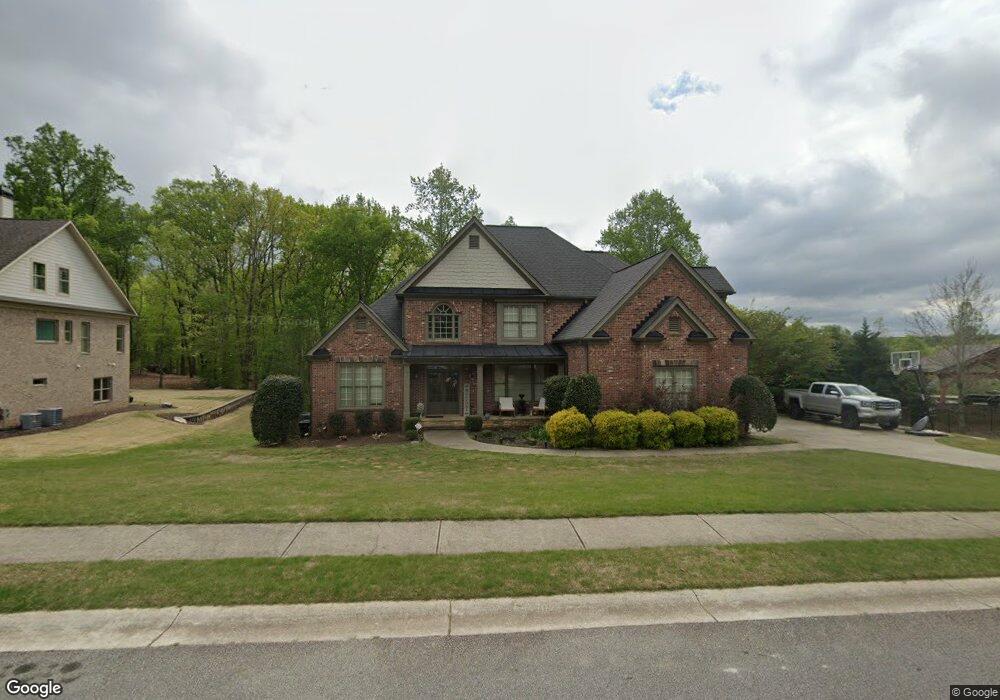
5029 Glen Forrest Dr Flowery Branch, GA 30542
Estimated Value: $671,000 - $793,000
4
Beds
4
Baths
2,802
Sq Ft
$267/Sq Ft
Est. Value
About This Home
This home is located at 5029 Glen Forrest Dr, Flowery Branch, GA 30542 and is currently estimated at $746,841, approximately $266 per square foot. 5029 Glen Forrest Dr is a home located in Hall County with nearby schools including Martin Elementary School, Southwest Middle School, and C.W. Davis Middle School.
Ownership History
Date
Name
Owned For
Owner Type
Purchase Details
Closed on
Sep 26, 2008
Sold by
Afb
Bought by
Johnson Benjamin H and Johnson Kristel L
Current Estimated Value
Home Financials for this Owner
Home Financials are based on the most recent Mortgage that was taken out on this home.
Original Mortgage
$272,250
Outstanding Balance
$181,561
Interest Rate
6.49%
Mortgage Type
New Conventional
Estimated Equity
$565,280
Purchase Details
Closed on
Jun 3, 2008
Sold by
Carillon Homes Llc
Bought by
Afb
Purchase Details
Closed on
Jul 7, 2005
Sold by
Estates Of Forrest Glen Llc
Bought by
Carillon Homes Llc
Home Financials for this Owner
Home Financials are based on the most recent Mortgage that was taken out on this home.
Original Mortgage
$396,700
Interest Rate
5.57%
Create a Home Valuation Report for This Property
The Home Valuation Report is an in-depth analysis detailing your home's value as well as a comparison with similar homes in the area
Home Values in the Area
Average Home Value in this Area
Purchase History
| Date | Buyer | Sale Price | Title Company |
|---|---|---|---|
| Johnson Benjamin H | $302,500 | -- | |
| Afb | $399,000 | -- | |
| Carillon Homes Llc | $77,000 | -- |
Source: Public Records
Mortgage History
| Date | Status | Borrower | Loan Amount |
|---|---|---|---|
| Open | Johnson Benjamin H | $272,250 | |
| Previous Owner | Carillon Homes Llc | $396,700 |
Source: Public Records
Tax History Compared to Growth
Tax History
| Year | Tax Paid | Tax Assessment Tax Assessment Total Assessment is a certain percentage of the fair market value that is determined by local assessors to be the total taxable value of land and additions on the property. | Land | Improvement |
|---|---|---|---|---|
| 2024 | $7,413 | $294,560 | $42,720 | $251,840 |
| 2023 | $6,691 | $280,960 | $42,720 | $238,240 |
| 2022 | $5,547 | $210,040 | $42,720 | $167,320 |
| 2021 | $4,771 | $176,560 | $17,800 | $158,760 |
| 2020 | $4,574 | $164,240 | $13,520 | $150,720 |
| 2019 | $4,336 | $154,080 | $13,240 | $140,840 |
| 2018 | $4,355 | $149,840 | $15,840 | $134,000 |
| 2017 | $3,980 | $138,040 | $15,840 | $122,200 |
| 2016 | $4,051 | $144,108 | $15,840 | $128,268 |
| 2015 | $4,078 | $144,108 | $15,840 | $128,268 |
| 2014 | $4,078 | $144,108 | $15,840 | $128,268 |
Source: Public Records
Map
Nearby Homes
- 5306 Highpoint Rd
- 5325 Highpoint Rd
- 5129 Glen Forrest Dr
- 5157 Glen Forrest Dr
- 5126 Cash Rd
- 5536 Rolling Mist Ct
- 5540 Rolling Mist Ct
- 5505 Riverchase Dr
- 5641 Wooded Valley Way
- 6512 Shady Valley Dr
- 5021 Limerick Ln
- 5610 Wooded Valley Way
- 5059 Lancashire Ct
- 4723 Grandview Pkwy
- 4711 Grandview Pkwy
- 5526 Chestnut Creek Ln
- 4826 Rose Heights Dr
- 5305 Mulberry Bend Ct
- 5023 Glen Forrest Dr Unit 33
- 5023 Glen Forrest Dr
- 5035 Glen Forrest Dr
- 5030 Glen Forrest Dr
- 5024 Glen Forrest Dr
- 5015 Glen Forrest Dr
- 5018 Glen Forrest Dr
- 5109 Glen Forrest Ct
- 5036 Glen Forrest Dr
- 5012 Glen Forrest Dr
- 5102 Glen Forrest Dr
- 5104 Glen Forrest Ct
- 5011 Glen Forrest Dr
- 5108 Glen Forrest Dr
- 5110 Glen Forrest Ct
- 5006 Glen Forrest Dr
- LOT 26 Glen Forrest Dr
- LOT 24 Glen Forrest Dr
- LOT 22 Glen Forrest Dr
- LOT 21 Glen Forrest Dr