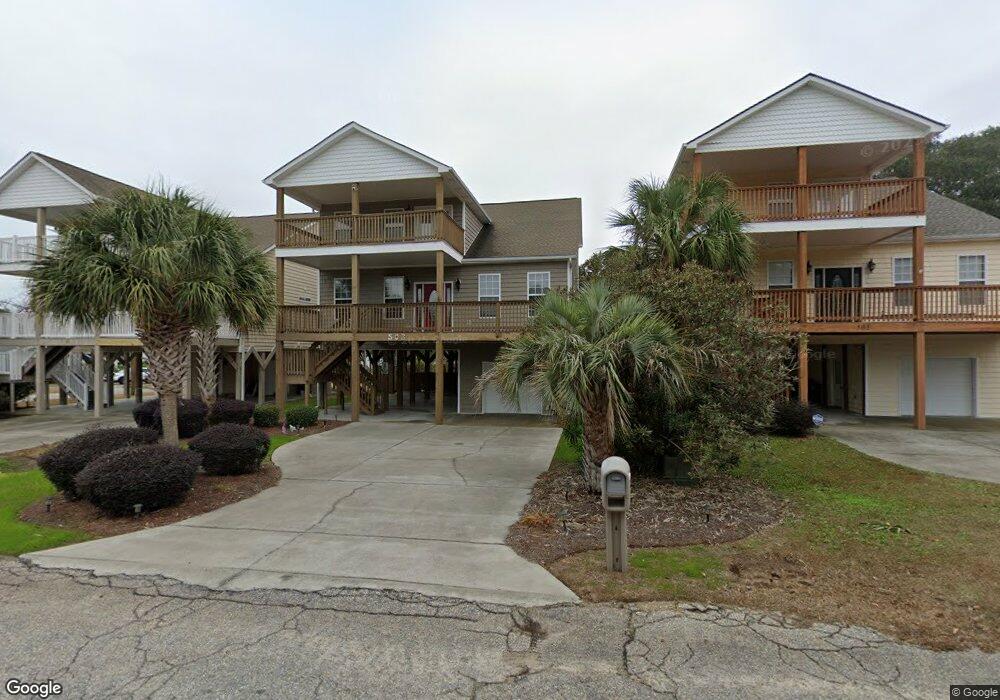
503 20th Ave S Unit 10-D North Myrtle Beach, SC 29582
Crescent Beach NeighborhoodEstimated Value: $343,292 - $387,000
3
Beds
2
Baths
1,328
Sq Ft
$280/Sq Ft
Est. Value
About This Home
This home is located at 503 20th Ave S Unit 10-D, North Myrtle Beach, SC 29582 and is currently estimated at $371,573, approximately $279 per square foot. 503 20th Ave S Unit 10-D is a home located in Horry County with nearby schools including Ocean Drive Elementary School, North Myrtle Beach Middle School, and North Myrtle Beach High School.
Ownership History
Date
Name
Owned For
Owner Type
Purchase Details
Closed on
Jun 1, 2022
Sold by
Wagoner John Y
Bought by
Wagoner Barbara H
Current Estimated Value
Purchase Details
Closed on
May 23, 2018
Sold by
Henderson Bruce D
Bought by
Wagoner John Jy
Home Financials for this Owner
Home Financials are based on the most recent Mortgage that was taken out on this home.
Original Mortgage
$158,720
Interest Rate
4.5%
Mortgage Type
New Conventional
Purchase Details
Closed on
Dec 19, 2013
Sold by
Wippel Patricia Smith
Bought by
Wippel Patricia Smith and The Pdj Smith Trust
Purchase Details
Closed on
Apr 27, 2012
Sold by
Smith Michael A
Bought by
Henderson Bruce D
Purchase Details
Closed on
Sep 28, 2007
Sold by
Oconnell Brian P and Oconnell Gioia L
Bought by
Smith Michael A and Smith Linda B
Home Financials for this Owner
Home Financials are based on the most recent Mortgage that was taken out on this home.
Original Mortgage
$208,600
Interest Rate
6.41%
Mortgage Type
Purchase Money Mortgage
Create a Home Valuation Report for This Property
The Home Valuation Report is an in-depth analysis detailing your home's value as well as a comparison with similar homes in the area
Home Values in the Area
Average Home Value in this Area
Purchase History
| Date | Buyer | Sale Price | Title Company |
|---|---|---|---|
| Wagoner Barbara H | -- | -- | |
| Wagoner John Jy | $198,400 | -- | |
| Wippel Patricia Smith | -- | -- | |
| Henderson Bruce D | $170,000 | -- | |
| Smith Michael A | $260,750 | Attorney |
Source: Public Records
Mortgage History
| Date | Status | Borrower | Loan Amount |
|---|---|---|---|
| Previous Owner | Wagoner John Jy | $158,720 | |
| Previous Owner | Smith Michael A | $208,600 |
Source: Public Records
Tax History Compared to Growth
Tax History
| Year | Tax Paid | Tax Assessment Tax Assessment Total Assessment is a certain percentage of the fair market value that is determined by local assessors to be the total taxable value of land and additions on the property. | Land | Improvement |
|---|---|---|---|---|
| 2024 | $703 | $20,460 | $0 | $20,460 |
| 2023 | $703 | $19,530 | $0 | $19,530 |
| 2021 | $2,526 | $19,530 | $0 | $19,530 |
| 2020 | $2,498 | $19,530 | $0 | $19,530 |
| 2019 | $2,409 | $19,530 | $0 | $19,530 |
| 2018 | $2,265 | $17,325 | $0 | $17,325 |
| 2017 | $2,245 | $9,900 | $0 | $9,900 |
| 2016 | -- | $9,900 | $0 | $9,900 |
| 2015 | $2,226 | $17,325 | $0 | $17,325 |
| 2014 | $2,154 | $9,900 | $0 | $9,900 |
Source: Public Records
Map
Nearby Homes
- 2005 Havens Dr
- 2012 Perrin Dr
- 405 21st Ave S Unit 2J
- 2010 Hillside Dr S
- 2104 Perrin Dr
- 505 19th Ave S
- 2013 S Ocean Blvd Unit 9C
- 1906 S Ocean Blvd
- 2001 S Ocean Blvd Unit 707
- 2009 S Ocean Blvd Unit 305
- 2009 S Ocean Blvd Unit 306 Crescent Vi
- 511 22nd Ave S
- 1903 S Ocean Blvd Unit PH4
- 1903 S Ocean Blvd Unit 1110
- 1903 S Ocean Blvd Unit 808
- 1903 S Ocean Blvd Unit 708
- 2204 Perrin Dr Unit 29
- 2202 S Ocean Blvd
- 500 23rd Ave S
- 1807 Hillside Dr S
- 501 20th Ave S
- 505 20th Ave S
- 505 20th Ave S
- 500 20th Ave S
- 2006 Havens Dr
- 2004 Havens Dr
- 509 20th Ave S
- 507 20th Ave S
- 405 20th Ave S
- 1910 Havens Dr
- 504 20th Ave S Unit 504 20th Ave South
- 504 20th Ave S
- 2008 Havens Dr
- 402 20th Ave S
- 511 20th Ave S
- 1912 Hillside Dr S
- 2005 Hillside Dr S
- 2005 Hillside Dr S Unit 11
- 1908 Havens Dr
- 1910 Holly Dr