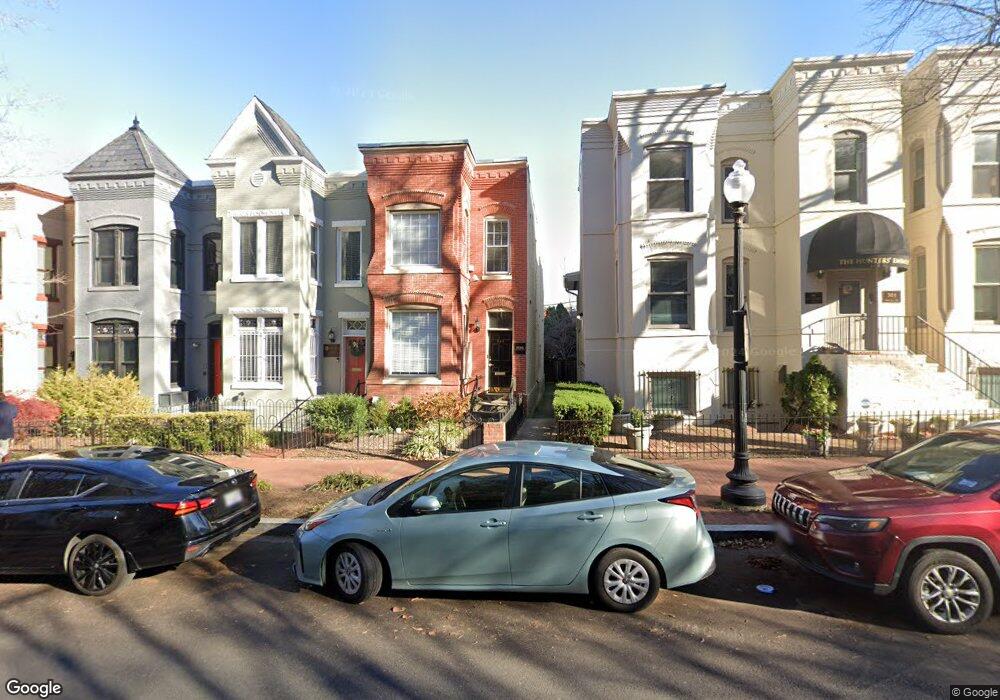
503 2nd St NE Washington, DC 20002
Capitol Hill Neighborhood
3
Beds
1
Bath
1,490
Sq Ft
1,350
Sq Ft Lot
About This Home
This home is located at 503 2nd St NE, Washington, DC 20002. 503 2nd St NE is a home located in District of Columbia with nearby schools including Ludlow-Taylor Elementary School, Stuart-Hobson Middle School, and Eastern High School.
Ownership History
Date
Name
Owned For
Owner Type
Purchase Details
Closed on
Dec 10, 2012
Sold by
503 2Nd Street Llc
Bought by
Redding Properties Llc
Home Financials for this Owner
Home Financials are based on the most recent Mortgage that was taken out on this home.
Original Mortgage
$1,300,000
Interest Rate
3.41%
Mortgage Type
Commercial
Purchase Details
Closed on
Feb 14, 2005
Sold by
Murphy Patrick M
Bought by
503 2Nd Street Llc
Home Financials for this Owner
Home Financials are based on the most recent Mortgage that was taken out on this home.
Original Mortgage
$744,000
Interest Rate
5.78%
Mortgage Type
Commercial
Purchase Details
Closed on
Mar 24, 2000
Sold by
Warren E Howard
Bought by
Murphy Patrick M
Home Financials for this Owner
Home Financials are based on the most recent Mortgage that was taken out on this home.
Original Mortgage
$310,400
Interest Rate
8.4%
Mortgage Type
Commercial
Create a Home Valuation Report for This Property
The Home Valuation Report is an in-depth analysis detailing your home's value as well as a comparison with similar homes in the area
Home Values in the Area
Average Home Value in this Area
Purchase History
| Date | Buyer | Sale Price | Title Company |
|---|---|---|---|
| Redding Properties Llc | $1,275,000 | -- | |
| 503 2Nd Street Llc | $1,050,000 | -- | |
| Murphy Patrick M | $388,000 | -- |
Source: Public Records
Mortgage History
| Date | Status | Borrower | Loan Amount |
|---|---|---|---|
| Previous Owner | Redding Properties Llc | $1,300,000 | |
| Previous Owner | 503 2Nd Street Llc | $744,000 | |
| Previous Owner | Murphy Patrick M | $310,400 |
Source: Public Records
Tax History Compared to Growth
Tax History
| Year | Tax Paid | Tax Assessment Tax Assessment Total Assessment is a certain percentage of the fair market value that is determined by local assessors to be the total taxable value of land and additions on the property. | Land | Improvement |
|---|---|---|---|---|
| 2024 | $33,259 | $2,015,720 | $649,710 | $1,366,010 |
| 2023 | $33,049 | $2,002,980 | $636,970 | $1,366,010 |
| 2022 | $32,079 | $1,944,180 | $636,970 | $1,307,210 |
| 2021 | $31,498 | $1,908,980 | $636,970 | $1,272,010 |
| 2020 | $30,081 | $1,823,070 | $579,060 | $1,244,010 |
| 2019 | $27,198 | $1,648,350 | $526,420 | $1,121,930 |
| 2018 | $24,664 | $1,494,800 | $0 | $0 |
| 2017 | $22,363 | $1,355,310 | $0 | $0 |
| 2016 | $20,034 | $1,214,200 | $0 | $0 |
| 2015 | $20,532 | $1,244,370 | $0 | $0 |
| 2014 | $19,251 | $1,166,730 | $0 | $0 |
Source: Public Records
Map
Nearby Homes
- 211 F St NE
- 424 4th St NE
- 301 G St NE Unit 2
- 315 G St NE Unit 304
- 307 4th St NE
- 305 C St NE Unit 410
- 305 C St NE Unit 401
- 439 5th St NE
- 316 5th St NE
- 737 3rd St NE
- 434 6th St NE
- 625 5th St NE Unit 1
- 716 4th St NE
- 410 G St NE
- 238 Maryland Ave NE Unit B
- 502 G St NE
- 328 Constitution Ave NE
- 632 Acker Place NE
- 629 Acker Place NE
- 609 Maryland Ave NE Unit 4