Estimated Value: $372,006 - $405,000
4
Beds
2
Baths
1,080
Sq Ft
$355/Sq Ft
Est. Value
About This Home
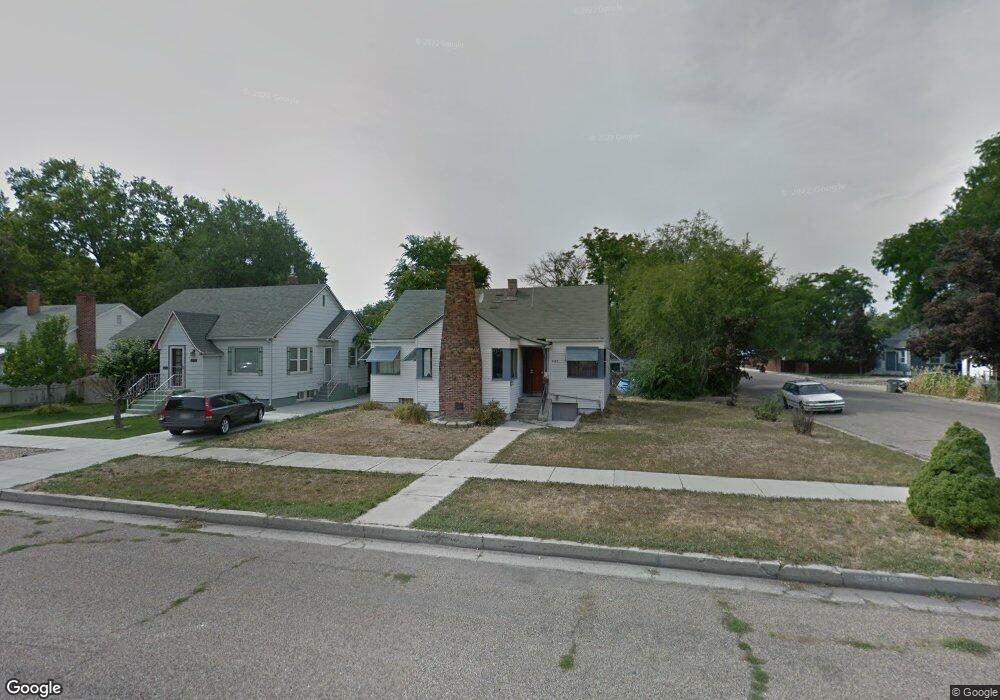
This home is located at 503 4th Ave S, Nampa, ID 83651 and is currently estimated at $383,502, approximately $355 per square foot. 503 4th Ave S is a home located in Canyon County with nearby schools including Central Elementary School, West Middle School, and Nampa Senior High School.
Ownership History
Date
Name
Owned For
Owner Type
Purchase Details
Closed on
Mar 9, 2017
Sold by
City Of Nampa
Bought by
Wells Fargo Bank Na
Current Estimated Value
Purchase Details
Closed on
Jul 27, 2015
Sold by
Merrell Phil D and Koberstein Anthony J
Bought by
City Of Nampa
Purchase Details
Closed on
Jul 31, 2014
Sold by
Wadley Betty M and Emerick Judith
Bought by
City Of Nampa
Purchase Details
Closed on
Jul 23, 2012
Sold by
Williams Kenneth and Diaz Refugio
Bought by
City Of Nampa
Create a Home Valuation Report for This Property
The Home Valuation Report is an in-depth analysis detailing your home's value as well as a comparison with similar homes in the area
Home Values in the Area
Average Home Value in this Area
Purchase History
| Date | Buyer | Sale Price | Title Company |
|---|---|---|---|
| Wells Fargo Bank Na | -- | None Available | |
| City Of Nampa | -- | None Available | |
| City Of Nampa | -- | None Available | |
| City Of Nampa | -- | None Available | |
| City Of Nampa | -- | None Available |
Source: Public Records
Tax History Compared to Growth
Tax History
| Year | Tax Paid | Tax Assessment Tax Assessment Total Assessment is a certain percentage of the fair market value that is determined by local assessors to be the total taxable value of land and additions on the property. | Land | Improvement |
|---|---|---|---|---|
| 2025 | $1,342 | $349,200 | $93,300 | $255,900 |
| 2024 | $1,342 | $341,750 | $87,650 | $254,100 |
| 2023 | $1,098 | $309,750 | $87,650 | $222,100 |
| 2022 | $1,487 | $326,400 | $105,000 | $221,400 |
| 2021 | $1,606 | $261,300 | $54,500 | $206,800 |
| 2020 | $1,527 | $217,900 | $43,700 | $174,200 |
| 2019 | $1,614 | $200,600 | $40,500 | $160,100 |
| 2018 | $1,430 | $0 | $0 | $0 |
| 2017 | $1,342 | $0 | $0 | $0 |
| 2016 | $1,172 | $0 | $0 | $0 |
| 2015 | $1,048 | $0 | $0 | $0 |
| 2014 | -- | $92,800 | $17,500 | $75,300 |
Source: Public Records
Map
Nearby Homes