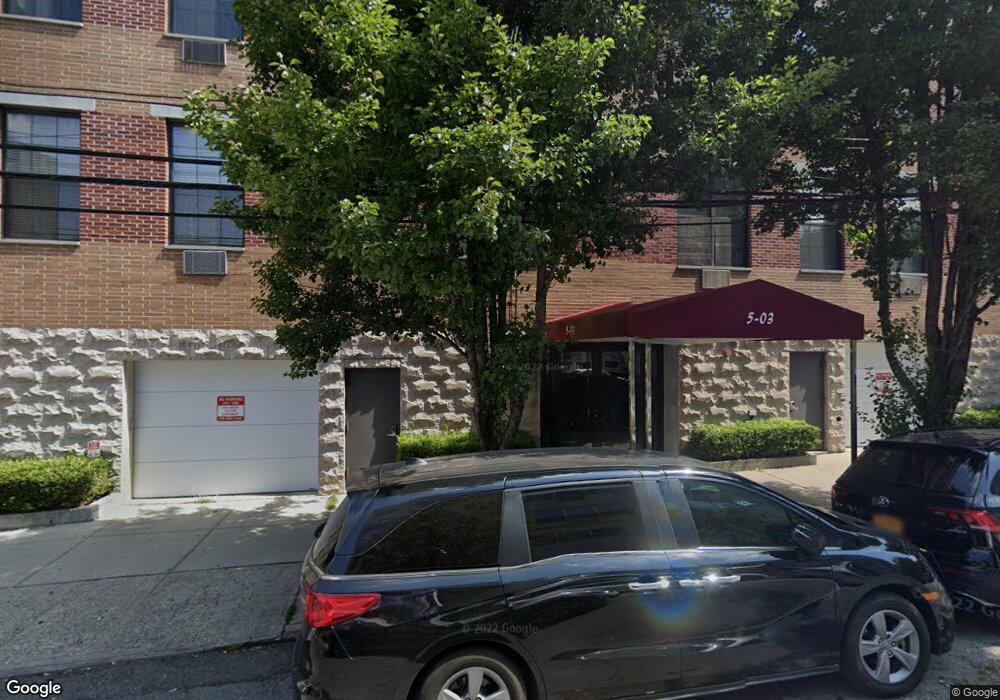
503 50th Ave Unit 4C Long Island City, NY 11101
Hunters Point NeighborhoodEstimated Value: $1,179,000 - $1,455,000
--
Bed
--
Bath
1,126
Sq Ft
$1,188/Sq Ft
Est. Value
About This Home
This home is located at 503 50th Ave Unit 4C, Long Island City, NY 11101 and is currently estimated at $1,337,411, approximately $1,187 per square foot. 503 50th Ave Unit 4C is a home located in Queens County with nearby schools including P.S./I.S. 78Q Early Childhood Center, I.S. 204 Oliver W. Holmes, and Long Island City High School.
Ownership History
Date
Name
Owned For
Owner Type
Purchase Details
Closed on
Sep 28, 2022
Sold by
Lee Jason Jaesung
Bought by
Manship Thomas
Current Estimated Value
Home Financials for this Owner
Home Financials are based on the most recent Mortgage that was taken out on this home.
Original Mortgage
$796,250
Outstanding Balance
$763,531
Interest Rate
5.55%
Mortgage Type
Purchase Money Mortgage
Estimated Equity
$573,880
Purchase Details
Closed on
Feb 28, 2013
Sold by
Grzhonko Lev
Bought by
Lee Jason Jae Sung
Home Financials for this Owner
Home Financials are based on the most recent Mortgage that was taken out on this home.
Original Mortgage
$517,500
Interest Rate
3.57%
Mortgage Type
New Conventional
Purchase Details
Closed on
May 1, 2007
Sold by
Jsl Realty Holdings Llc
Bought by
Grzhonko Lev
Home Financials for this Owner
Home Financials are based on the most recent Mortgage that was taken out on this home.
Original Mortgage
$664,000
Interest Rate
6.18%
Create a Home Valuation Report for This Property
The Home Valuation Report is an in-depth analysis detailing your home's value as well as a comparison with similar homes in the area
Home Values in the Area
Average Home Value in this Area
Purchase History
| Date | Buyer | Sale Price | Title Company |
|---|---|---|---|
| Manship Thomas | $1,225,000 | -- | |
| Lee Jason Jae Sung | $690,000 | -- | |
| Lee Jason Jae Sung | $690,000 | -- | |
| Grzhonko Lev | $830,000 | -- | |
| Grzhonko Lev | $830,000 | -- |
Source: Public Records
Mortgage History
| Date | Status | Borrower | Loan Amount |
|---|---|---|---|
| Open | Manship Thomas | $796,250 | |
| Previous Owner | Lee Jason Jae Sung | $517,500 | |
| Previous Owner | Grzhonko Lev | $664,000 |
Source: Public Records
Tax History Compared to Growth
Tax History
| Year | Tax Paid | Tax Assessment Tax Assessment Total Assessment is a certain percentage of the fair market value that is determined by local assessors to be the total taxable value of land and additions on the property. | Land | Improvement |
|---|---|---|---|---|
| 2025 | $12,610 | $100,485 | $9,622 | $90,863 |
| 2024 | $12,610 | $100,866 | $9,622 | $91,244 |
| 2023 | $12,372 | $98,964 | $9,622 | $89,342 |
| 2022 | $9,808 | $98,989 | $9,622 | $89,367 |
| 2021 | $7,516 | $98,884 | $9,622 | $89,262 |
| 2020 | $5,231 | $112,899 | $9,622 | $103,277 |
| 2019 | $2,755 | $108,815 | $9,622 | $99,193 |
| 2018 | $616 | $81,124 | $9,622 | $71,502 |
| 2017 | $616 | $74,036 | $9,622 | $64,414 |
| 2016 | $625 | $74,036 | $9,622 | $64,414 |
| 2015 | $488 | $69,947 | $10,491 | $59,456 |
| 2014 | $488 | $70,359 | $11,031 | $59,328 |
Source: Public Records
Map
Nearby Homes
- 5-17 51st Ave
- 5-27 51st Ave Unit PH-B
- 2-26 50th Ave Unit 9-C
- 2-26 50th Ave Unit 11-B
- 2-26 50th Ave Unit 10-F
- 5-49 Borden Ave Unit 3C
- 5-49 Borden Ave Unit 4K
- 2-17 51st Ave Unit 311
- 2-17 51st Ave Unit 621
- 2-17 51st Ave Unit 913
- 4-74 48th Ave Unit 17j
- 4-74 48th Ave Unit 25A
- 4-74 48th Ave Unit 17A
- 4-74 48th Ave Unit 27-A
- 4-74 48th Ave Unit 35-L
- 4-74 48th Ave Unit PH-4D
- 4-74 48th Ave Unit PH2B
- 4-74 48th Ave Unit 9L
- 4-74 48th Ave Unit 8-F
- 5-09 48th Ave Unit 5-M
- 5-03 50th Ave Unit 2-D
- 503 50th Ave Unit 4B
- 503 50th Ave Unit 2B
- 503 50th Ave Unit 5B
- 503 50th Ave Unit 5A
- 503 50th Ave Unit 4A
- 503 50th Ave Unit 3A
- 503 50th Ave Unit 2D
- 503 50th Ave Unit 2A
- 503 50th Ave Unit 3C
- 503 50th Ave Unit 3B
- 503 50th Ave Unit 2C
- 5-03 50th Ave Unit 4 A
- 5-03 50th Ave Unit PH 5 B
- 5-03 50th Ave
- 5-03 50th Ave Unit 3A
- 503 50th Ave
- 5-03 50th Ave Unit 3B
- 5-03 50th Ave Unit 3C