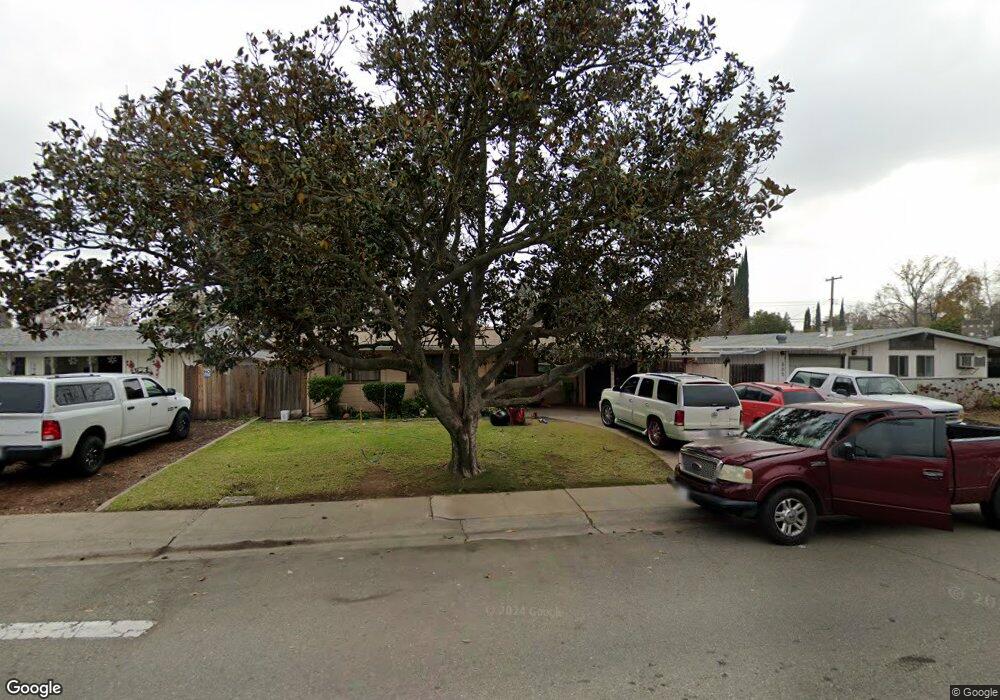
503 6th St Roseville, CA 95678
Theiles Manor NeighborhoodEstimated Value: $331,000 - $382,000
3
Beds
1
Bath
974
Sq Ft
$369/Sq Ft
Est. Value
About This Home
This home is located at 503 6th St, Roseville, CA 95678 and is currently estimated at $358,991, approximately $368 per square foot. 503 6th St is a home located in Placer County with nearby schools including George Cirby Elementary School, Warren T. Eich Middle School, and Oakmont High School.
Ownership History
Date
Name
Owned For
Owner Type
Purchase Details
Closed on
May 20, 2024
Sold by
Smith Patricia Ann and Adams Patricia L
Bought by
Adams Patricia L
Current Estimated Value
Purchase Details
Closed on
Nov 13, 2006
Sold by
Adams Sherrie A and Smith Owen Patricia A
Bought by
Adams Sherrie A
Home Financials for this Owner
Home Financials are based on the most recent Mortgage that was taken out on this home.
Original Mortgage
$100,000
Interest Rate
6.15%
Mortgage Type
Stand Alone Refi Refinance Of Original Loan
Create a Home Valuation Report for This Property
The Home Valuation Report is an in-depth analysis detailing your home's value as well as a comparison with similar homes in the area
Home Values in the Area
Average Home Value in this Area
Purchase History
| Date | Buyer | Sale Price | Title Company |
|---|---|---|---|
| Adams Patricia L | -- | None Listed On Document | |
| Adams Sherrie A | -- | First American Title Ins |
Source: Public Records
Mortgage History
| Date | Status | Borrower | Loan Amount |
|---|---|---|---|
| Previous Owner | Adams Sherrie A | $100,000 |
Source: Public Records
Tax History
| Year | Tax Paid | Tax Assessment Tax Assessment Total Assessment is a certain percentage of the fair market value that is determined by local assessors to be the total taxable value of land and additions on the property. | Land | Improvement |
|---|---|---|---|---|
| 2025 | $1,071 | $109,065 | $53,574 | $55,491 |
| 2023 | $1,071 | $96,000 | $47,200 | $48,800 |
| 2022 | $1,050 | $102,778 | $50,486 | $52,292 |
| 2021 | $1,024 | $100,764 | $49,497 | $51,267 |
| 2020 | $1,020 | $99,732 | $48,990 | $50,742 |
| 2019 | $1,005 | $97,778 | $48,030 | $49,748 |
| 2018 | $966 | $95,862 | $47,089 | $48,773 |
| 2017 | $953 | $93,983 | $46,166 | $47,817 |
| 2016 | $959 | $92,141 | $45,261 | $46,880 |
| 2015 | $939 | $90,758 | $44,582 | $46,176 |
| 2014 | $923 | $88,981 | $43,709 | $45,272 |
Source: Public Records
Map
Nearby Homes
- 502 Dudley Dr
- 232 La Rue Aly
- 2000 Inglis Way Unit A
- 210 C St
- 2152 Milan Way
- 2054 Ajay Dr
- 1342 Church St
- 123 Valley Oak Dr Unit 34
- 115 Valley Oak Dr
- 0 Bonita St
- 231 Live Oak Cir Unit 2
- 1110 Circuit Dr
- 984 Portside Cir
- 215 Ardmore Ave
- 629 Oak St
- 912 Portside Cir
- 930 Circuit Dr
- 125 Willow Ave
- 707 Jo Anne Ln
- 1309 Hickory St
Your Personal Tour Guide
Ask me questions while you tour the home.