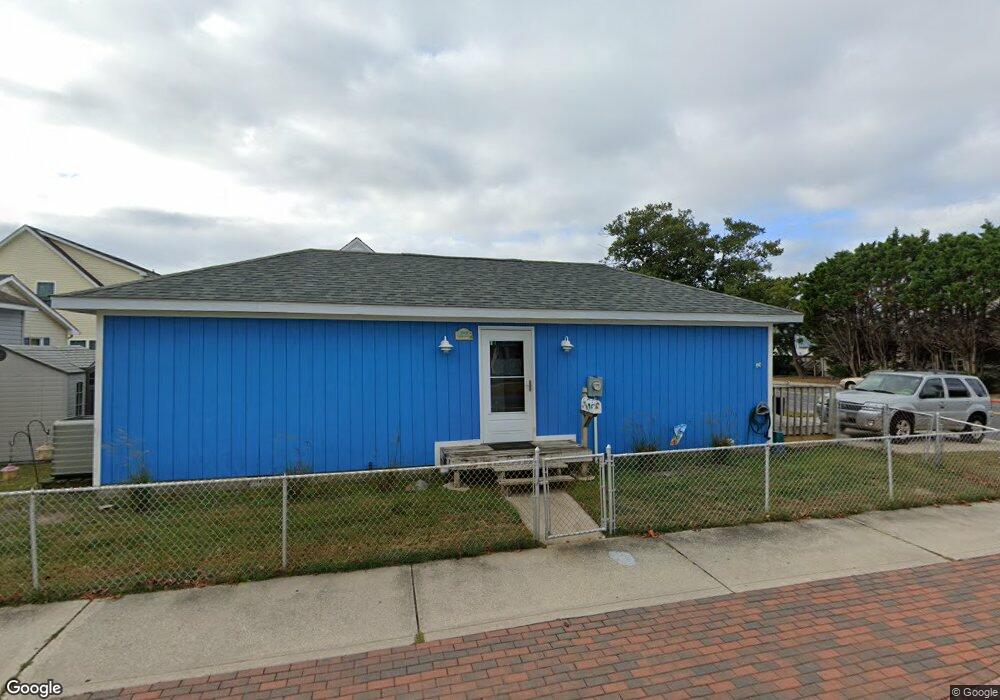
503 94th St Ocean City, MD 21842
Estimated Value: $278,351 - $449,000
--
Bed
1
Bath
680
Sq Ft
$508/Sq Ft
Est. Value
About This Home
This home is located at 503 94th St, Ocean City, MD 21842 and is currently estimated at $345,588, approximately $508 per square foot. 503 94th St is a home located in Worcester County with nearby schools including Ocean City Elementary School, Stephen Decatur Middle School, and Berlin Intermediate School.
Ownership History
Date
Name
Owned For
Owner Type
Purchase Details
Closed on
Sep 22, 2015
Sold by
Mortl Douglas Francis and Mortl Sharon Wulkie
Bought by
Wamhoff John J and Wamhoff Dorothy E
Current Estimated Value
Home Financials for this Owner
Home Financials are based on the most recent Mortgage that was taken out on this home.
Original Mortgage
$127,260
Outstanding Balance
$100,159
Interest Rate
3.97%
Mortgage Type
New Conventional
Estimated Equity
$245,429
Purchase Details
Closed on
Jun 12, 2013
Sold by
Mortl Douglas F and Wilkie Mortl Sharon
Bought by
Mortl Douglas Francis and Wilkie Mortl Sharon
Purchase Details
Closed on
Feb 28, 1983
Sold by
Sintetos Alexander T
Bought by
Mortl Douglas F and Sharon Wilkie
Home Financials for this Owner
Home Financials are based on the most recent Mortgage that was taken out on this home.
Original Mortgage
$53,600
Interest Rate
12.98%
Create a Home Valuation Report for This Property
The Home Valuation Report is an in-depth analysis detailing your home's value as well as a comparison with similar homes in the area
Home Values in the Area
Average Home Value in this Area
Purchase History
| Date | Buyer | Sale Price | Title Company |
|---|---|---|---|
| Wamhoff John J | $141,400 | None Available | |
| Mortl Douglas Francis | -- | None Available | |
| Mortl Douglas F | $57,000 | -- |
Source: Public Records
Mortgage History
| Date | Status | Borrower | Loan Amount |
|---|---|---|---|
| Open | Wamhoff John J | $127,260 | |
| Previous Owner | Mortl Douglas F | $53,600 |
Source: Public Records
Tax History Compared to Growth
Tax History
| Year | Tax Paid | Tax Assessment Tax Assessment Total Assessment is a certain percentage of the fair market value that is determined by local assessors to be the total taxable value of land and additions on the property. | Land | Improvement |
|---|---|---|---|---|
| 2025 | $2,700 | $197,733 | $0 | $0 |
| 2024 | $2,461 | $176,367 | $0 | $0 |
| 2023 | $2,178 | $155,000 | $112,000 | $43,000 |
| 2022 | $2,125 | $151,200 | $0 | $0 |
| 2021 | $2,083 | $147,400 | $0 | $0 |
| 2020 | $2,029 | $143,600 | $112,000 | $31,600 |
| 2019 | $2,043 | $143,600 | $112,000 | $31,600 |
| 2018 | $2,022 | $143,600 | $112,000 | $31,600 |
| 2017 | $2,058 | $145,700 | $0 | $0 |
| 2016 | -- | $144,133 | $0 | $0 |
| 2015 | $2,274 | $142,567 | $0 | $0 |
| 2014 | $2,274 | $141,000 | $0 | $0 |
Source: Public Records
Map
Nearby Homes
- 9307 Chesapeake Dr
- 9307 Chesapeake Dr
- 8601 Chesapeake Dr
- 8703 Mediterranean Dr
- 604 S Pacific Ave
- 9106 E Biscayne Dr
- 9103 Coastal Hwy
- 9400 Coastal Hwy Unit 301
- 9400 Coastal Hwy Unit 802
- 9400 Coastal Hwy Unit 1706
- 9400 Coastal Hwy Unit 1901
- 9400 Coastal Hwy Unit 1001
- 9400 Coastal Hwy Unit 1907
- 9400 Coastal Hwy Unit 1804
- 615 Salt Spray Rd
- 616 Salt Spray Rd Unit 6
- 9007 Coastal Hwy
- 12 92nd St Unit 104
- 7 93rd St
- 9002 Coastal Hwy Unit 106
- 9310 Chesapeake Dr
- 502 Artic Ave
- 9311 Caribbean Dr
- 9308 Chesapeake Dr
- 501 94th St
- 9313 Chesapeake Dr
- 9309 Caribbean Dr
- 9307 Caribbean Dr
- 600 94th St
- 603C 94th St
- 9306 Chesapeake Dr
- 603BB 94th St
- 603 94th St
- 603 94th St Unit C
- 603 94th St Unit A
- 603 94th St Unit B
- 603B 94th St
- 9304 Chesapeake Dr
- 502 94th St
- 403 Caribbean Dr