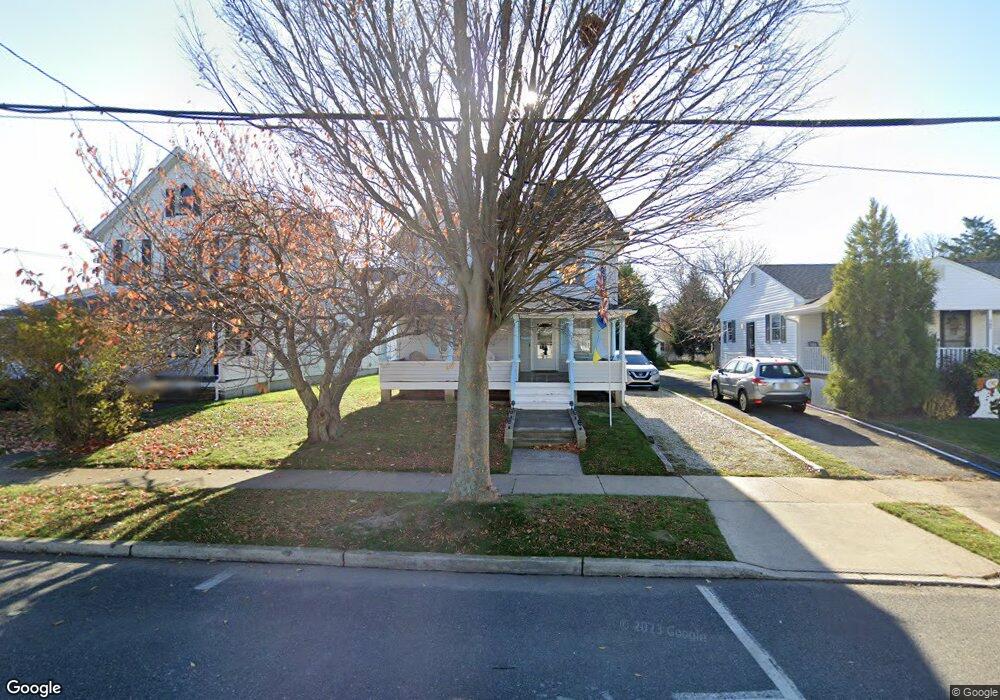
503 9th Ave Belmar, NJ 07719
Estimated Value: $902,000 - $1,441,000
3
Beds
2
Baths
1,684
Sq Ft
$691/Sq Ft
Est. Value
About This Home
This home is located at 503 9th Ave, Belmar, NJ 07719 and is currently estimated at $1,163,431, approximately $690 per square foot. 503 9th Ave is a home located in Monmouth County with nearby schools including Belmar Elementary School, St. Rose Grammar School, and St Rose High School.
Ownership History
Date
Name
Owned For
Owner Type
Purchase Details
Closed on
Aug 23, 2019
Sold by
Usiatynski Walter A and Martine Usiatynski Nancy
Bought by
Usiatynski Walter A
Current Estimated Value
Purchase Details
Closed on
Oct 19, 2012
Sold by
Ustatynski Walter A and Ustatynski Walter A
Bought by
Usiatynski Walter A and Martine-Usiatynski Nancy
Home Financials for this Owner
Home Financials are based on the most recent Mortgage that was taken out on this home.
Original Mortgage
$220,000
Outstanding Balance
$152,701
Interest Rate
3.56%
Mortgage Type
New Conventional
Estimated Equity
$1,010,730
Purchase Details
Closed on
Oct 24, 1994
Sold by
Walliczek Norbert
Bought by
Usiatynski Walter
Home Financials for this Owner
Home Financials are based on the most recent Mortgage that was taken out on this home.
Original Mortgage
$123,000
Interest Rate
8.65%
Create a Home Valuation Report for This Property
The Home Valuation Report is an in-depth analysis detailing your home's value as well as a comparison with similar homes in the area
Home Values in the Area
Average Home Value in this Area
Purchase History
| Date | Buyer | Sale Price | Title Company |
|---|---|---|---|
| Usiatynski Walter A | -- | None Available | |
| Usiatynski Walter A | -- | None Available | |
| Usiatynski Walter | $153,500 | -- |
Source: Public Records
Mortgage History
| Date | Status | Borrower | Loan Amount |
|---|---|---|---|
| Open | Usiatynski Walter A | $220,000 | |
| Previous Owner | Usiatynski Walter | $123,000 |
Source: Public Records
Tax History
| Year | Tax Paid | Tax Assessment Tax Assessment Total Assessment is a certain percentage of the fair market value that is determined by local assessors to be the total taxable value of land and additions on the property. | Land | Improvement |
|---|---|---|---|---|
| 2025 | $9,391 | $645,400 | $450,000 | $195,400 |
| 2024 | $9,074 | $645,400 | $450,000 | $195,400 |
Source: Public Records
Map
Nearby Homes
Your Personal Tour Guide
Ask me questions while you tour the home.