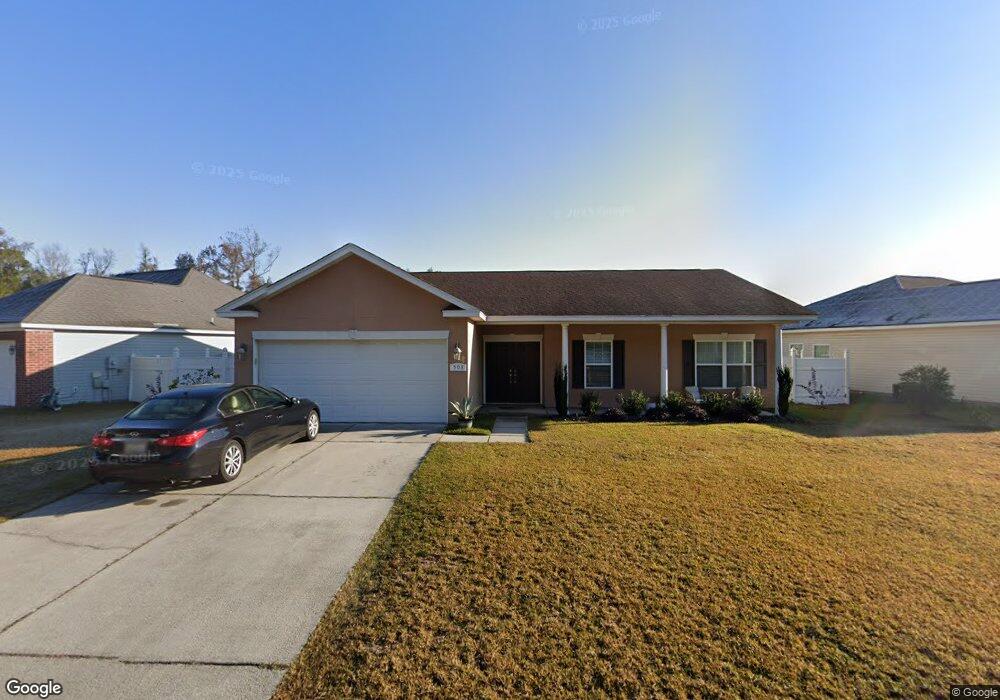
503 Amsonia Cir Unit g Guyton, GA 31312
Estimated Value: $284,475 - $315,000
3
Beds
2
Baths
1,360
Sq Ft
$221/Sq Ft
Est. Value
About This Home
This home is located at 503 Amsonia Cir Unit g, Guyton, GA 31312 and is currently estimated at $300,869, approximately $221 per square foot. 503 Amsonia Cir Unit g is a home located in Effingham County with nearby schools including South Effingham Elementary School, South Effingham Middle School, and South Effingham High School.
Ownership History
Date
Name
Owned For
Owner Type
Purchase Details
Closed on
Mar 19, 2021
Sold by
Ruberti Kelly Christine
Bought by
Lahey Ryan T
Current Estimated Value
Home Financials for this Owner
Home Financials are based on the most recent Mortgage that was taken out on this home.
Original Mortgage
$206,060
Outstanding Balance
$184,199
Interest Rate
2.8%
Mortgage Type
New Conventional
Estimated Equity
$116,670
Purchase Details
Closed on
Jul 23, 2015
Sold by
Whittamore Tiffany R
Bought by
Jackson Kelly Christine
Home Financials for this Owner
Home Financials are based on the most recent Mortgage that was taken out on this home.
Original Mortgage
$146,202
Interest Rate
4.5%
Mortgage Type
FHA
Purchase Details
Closed on
Feb 11, 2010
Sold by
Park West/Effingham Lp
Bought by
Whittamore Tiffany R
Home Financials for this Owner
Home Financials are based on the most recent Mortgage that was taken out on this home.
Original Mortgage
$142,698
Interest Rate
5%
Mortgage Type
New Conventional
Purchase Details
Closed on
Aug 6, 2004
Bought by
Park West Effingham Lp
Create a Home Valuation Report for This Property
The Home Valuation Report is an in-depth analysis detailing your home's value as well as a comparison with similar homes in the area
Home Values in the Area
Average Home Value in this Area
Purchase History
| Date | Buyer | Sale Price | Title Company |
|---|---|---|---|
| Lahey Ryan T | $204,000 | -- | |
| Jackson Kelly Christine | $148,900 | -- | |
| Whittamore Tiffany R | $139,900 | -- | |
| Park West Effingham Lp | -- | -- |
Source: Public Records
Mortgage History
| Date | Status | Borrower | Loan Amount |
|---|---|---|---|
| Open | Lahey Ryan T | $206,060 | |
| Previous Owner | Jackson Kelly Christine | $146,202 | |
| Previous Owner | Whittamore Tiffany R | $142,698 |
Source: Public Records
Tax History Compared to Growth
Tax History
| Year | Tax Paid | Tax Assessment Tax Assessment Total Assessment is a certain percentage of the fair market value that is determined by local assessors to be the total taxable value of land and additions on the property. | Land | Improvement |
|---|---|---|---|---|
| 2025 | $4,228 | $125,950 | $22,800 | $103,150 |
| 2024 | $4,228 | $109,984 | $22,800 | $87,184 |
| 2023 | $3,068 | $101,425 | $17,600 | $83,825 |
| 2022 | $2,614 | $78,926 | $16,000 | $62,926 |
| 2021 | $2,512 | $75,239 | $14,000 | $61,239 |
| 2020 | $2,339 | $70,015 | $12,000 | $58,015 |
| 2019 | $2,293 | $68,015 | $10,000 | $58,015 |
| 2018 | $2,196 | $63,846 | $10,000 | $53,846 |
| 2017 | $2,068 | $59,029 | $7,500 | $51,529 |
| 2016 | $1,954 | $58,087 | $7,500 | $50,587 |
| 2015 | -- | $56,187 | $5,600 | $50,587 |
| 2014 | -- | $56,187 | $5,600 | $50,587 |
| 2013 | -- | $52,827 | $2,240 | $50,587 |
Source: Public Records
Map
Nearby Homes
- 807 Hyacinth Cir
- 404 Banberry Ct
- 804 Hyacinth Cir
- 126 Tobago Cir
- 144 Tobago Cir
- 107 Tupelo Trail
- 100 Butternut Blvd
- 225 Caribbean Village Dr
- 201 Antigua Place
- 178 Tobago Cir
- 276 Caribbean Village Dr
- 247 Caribbean Village Dr
- 275 Caribbean Village Dr
- 131 Butternut Ct
- 108 Cotton Bluff Ct
- 184 Brookline Dr
- 194 Brookline Dr
- 29 Allston Ln
- 181 Brookline Dr
- 213 Brookline Dr
- 503 Amsonia Cir
- 505 Amsonia Cir
- 501 Amsonia Cir
- 507 Amsonia Cir
- 506 Amsonia Cir
- 508 Amsonia Cir
- 504 Amsonia Cir
- 510 Amsonia Cir
- 502 Amsonia Cir
- 509 Amsonia Cir
- 127 Caribbean Village Dr
- 129 Caribbean Village Dr
- 500 Amsonia Cir
- 125 Caribbean Village Dr
- 601 Thimbleweed Ct
- 512 Amsonia Cir
- 511 Amsonia Cir
- 123 Caribbean Village Dr
- 603 Thimbleweed Ct
- 514 Amsonia Cir