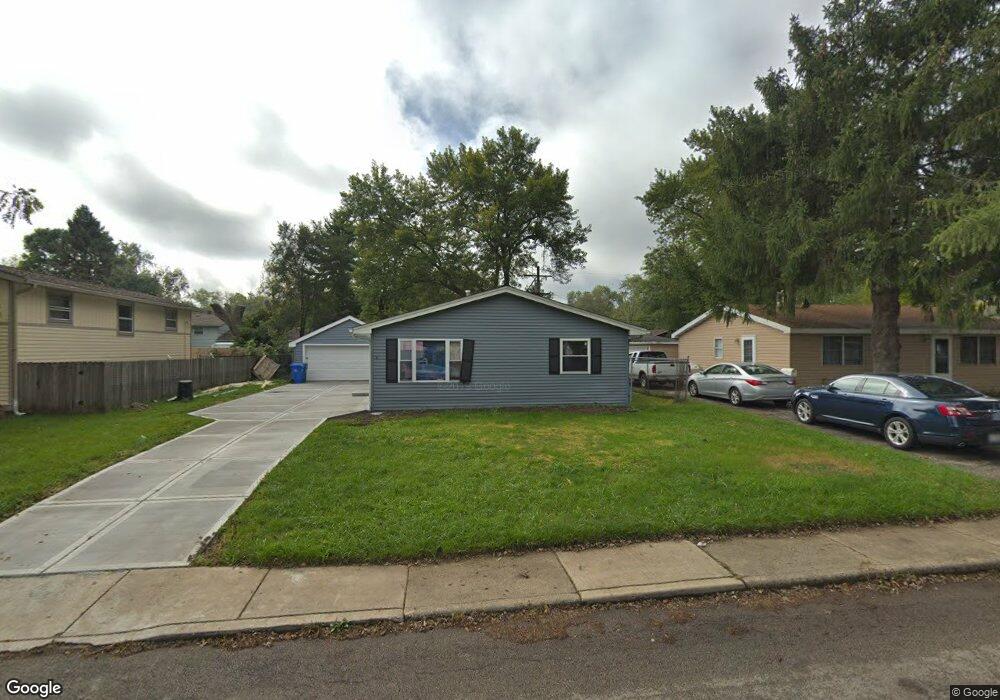
503 Apache Ave Carpentersville, IL 60110
Estimated Value: $259,500 - $275,000
3
Beds
--
Bath
1,036
Sq Ft
$258/Sq Ft
Est. Value
About This Home
This home is located at 503 Apache Ave, Carpentersville, IL 60110 and is currently estimated at $267,625, approximately $258 per square foot. 503 Apache Ave is a home located in Kane County with nearby schools including Sunny Hill Elementary School, Barrington Mdle School- Prairie Cmps, and Barrington High School.
Ownership History
Date
Name
Owned For
Owner Type
Purchase Details
Closed on
Jul 24, 2019
Sold by
Mark Holdings Llc
Bought by
Alvarado Pablo and Alvarado Maria
Current Estimated Value
Home Financials for this Owner
Home Financials are based on the most recent Mortgage that was taken out on this home.
Original Mortgage
$116,000
Outstanding Balance
$102,506
Interest Rate
4.25%
Mortgage Type
New Conventional
Estimated Equity
$165,119
Purchase Details
Closed on
Jan 8, 2018
Sold by
Urbina Jesusita R and The Bankof New York Mellon
Bought by
Mark Holdings Llc
Purchase Details
Closed on
May 23, 1997
Sold by
Urbina Jesusita R
Bought by
Urbina Ricardo and Urbina Jesusita R
Home Financials for this Owner
Home Financials are based on the most recent Mortgage that was taken out on this home.
Original Mortgage
$53,940
Interest Rate
11.85%
Mortgage Type
Assumption
Create a Home Valuation Report for This Property
The Home Valuation Report is an in-depth analysis detailing your home's value as well as a comparison with similar homes in the area
Home Values in the Area
Average Home Value in this Area
Purchase History
| Date | Buyer | Sale Price | Title Company |
|---|---|---|---|
| Alvarado Pablo | $146,000 | First American Title | |
| Mark Holdings Llc | $107,000 | Attorney | |
| Urbina Ricardo | -- | Wheatland Title |
Source: Public Records
Mortgage History
| Date | Status | Borrower | Loan Amount |
|---|---|---|---|
| Open | Alvarado Pablo | $116,000 | |
| Previous Owner | Urbina Ricardo | $53,940 |
Source: Public Records
Tax History Compared to Growth
Tax History
| Year | Tax Paid | Tax Assessment Tax Assessment Total Assessment is a certain percentage of the fair market value that is determined by local assessors to be the total taxable value of land and additions on the property. | Land | Improvement |
|---|---|---|---|---|
| 2024 | $5,525 | $71,497 | $12,553 | $58,944 |
| 2023 | $5,317 | $64,331 | $11,295 | $53,036 |
| 2022 | $3,716 | $49,255 | $11,295 | $37,960 |
| 2021 | $3,557 | $46,507 | $10,665 | $35,842 |
| 2020 | $3,387 | $45,461 | $10,425 | $35,036 |
| 2019 | $3,416 | $39,858 | $9,897 | $29,961 |
| 2018 | $3,378 | $43,745 | $9,701 | $34,044 |
| 2017 | $3,124 | $40,922 | $9,075 | $31,847 |
| 2016 | $1,916 | $26,373 | $8,787 | $17,586 |
| 2015 | -- | $28,516 | $8,234 | $20,282 |
| 2014 | -- | $25,616 | $8,007 | $17,609 |
| 2013 | -- | $26,400 | $8,252 | $18,148 |
Source: Public Records
Map
Nearby Homes
- 336 Delaware St
- 155 Helm Rd
- 153 Algonquin Rd
- 944 Cortney Dr
- 103 Hickory Dr
- 94 Wren Rd
- 140 Hickory Dr
- 7 Autumn Trail
- 57 Robin Rd
- 1811 IL Rte 25 (Elgin) Rd
- 1426 Kings Rd
- 225 Westfield Way
- 105 Siesta Rd
- 7 Hickory Dr
- 2013 Silverstone Dr Unit 2013
- 2245 Flagstone Ln Unit 155
- 200 Amarillo Dr
- 1431 Silverstone Dr Unit 1416
- 7 Austin Ave
- 308 Amarillo Ct
- 505 Apache Ave
- 501 Apache Ave
- 117 Sioux Ave
- 402 Blackhawk Ave
- 507 Apache Ave
- 404 Blackhawk Ave
- 400 Blackhawk Ave
- 502 Apache Ave
- 600 Santa fe Ave
- 406 Blackhawk Ave Unit 5
- 509 Apache Ave
- 500 Apache Ave
- 408 Blackhawk Ave
- 601 Santa fe Ave
- 116 Sioux Ave
- 118 Sioux Ave Unit 5
- 511 Apache Ave
- 602 Santa fe Ave
- 114 Sioux Ave
- 125 Sioux Ave Unit 5