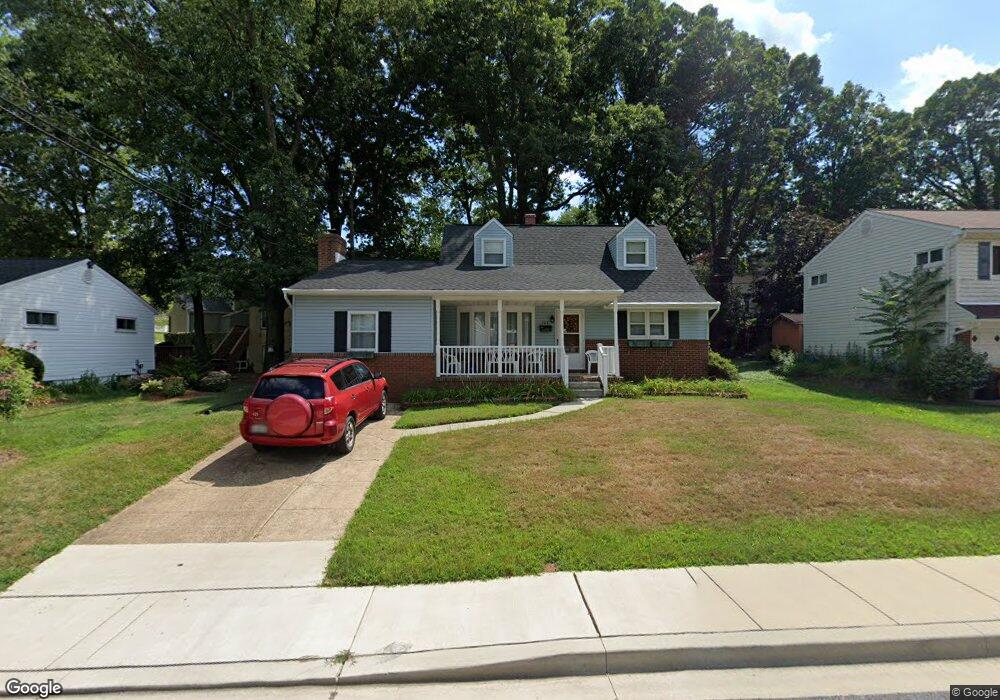
503 Baylor Rd Glen Burnie, MD 21061
Estimated Value: $326,000 - $462,000
--
Bed
3
Baths
1,638
Sq Ft
$239/Sq Ft
Est. Value
About This Home
This home is located at 503 Baylor Rd, Glen Burnie, MD 21061 and is currently estimated at $392,083, approximately $239 per square foot. 503 Baylor Rd is a home located in Anne Arundel County with nearby schools including Glen Burnie Park Elementary School, Old Mill High School, and Granite Baptist School.
Ownership History
Date
Name
Owned For
Owner Type
Purchase Details
Closed on
Jun 4, 2021
Sold by
Clark Patricia A
Bought by
Clark Patricia A and Clark Heather C
Current Estimated Value
Purchase Details
Closed on
Nov 10, 2009
Sold by
Tress Patricia A
Bought by
Clark Patricia A
Home Financials for this Owner
Home Financials are based on the most recent Mortgage that was taken out on this home.
Original Mortgage
$75,000
Interest Rate
5.36%
Mortgage Type
New Conventional
Create a Home Valuation Report for This Property
The Home Valuation Report is an in-depth analysis detailing your home's value as well as a comparison with similar homes in the area
Home Values in the Area
Average Home Value in this Area
Purchase History
| Date | Buyer | Sale Price | Title Company |
|---|---|---|---|
| Clark Patricia A | -- | None Available | |
| Clark Patricia A | -- | -- |
Source: Public Records
Mortgage History
| Date | Status | Borrower | Loan Amount |
|---|---|---|---|
| Closed | Clark Patricia A | $75,000 |
Source: Public Records
Tax History Compared to Growth
Tax History
| Year | Tax Paid | Tax Assessment Tax Assessment Total Assessment is a certain percentage of the fair market value that is determined by local assessors to be the total taxable value of land and additions on the property. | Land | Improvement |
|---|---|---|---|---|
| 2025 | $2,889 | $318,200 | $144,300 | $173,900 |
| 2024 | $2,889 | $303,833 | $0 | $0 |
| 2023 | $2,798 | $289,467 | $0 | $0 |
| 2022 | $2,605 | $275,100 | $144,300 | $130,800 |
| 2021 | $5,119 | $267,100 | $0 | $0 |
| 2020 | $2,474 | $259,100 | $0 | $0 |
| 2019 | $2,431 | $251,100 | $124,300 | $126,800 |
| 2018 | $2,544 | $250,933 | $0 | $0 |
| 2017 | $2,307 | $250,767 | $0 | $0 |
| 2016 | -- | $250,600 | $0 | $0 |
| 2015 | -- | $244,800 | $0 | $0 |
| 2014 | -- | $239,000 | $0 | $0 |
Source: Public Records
Map
Nearby Homes