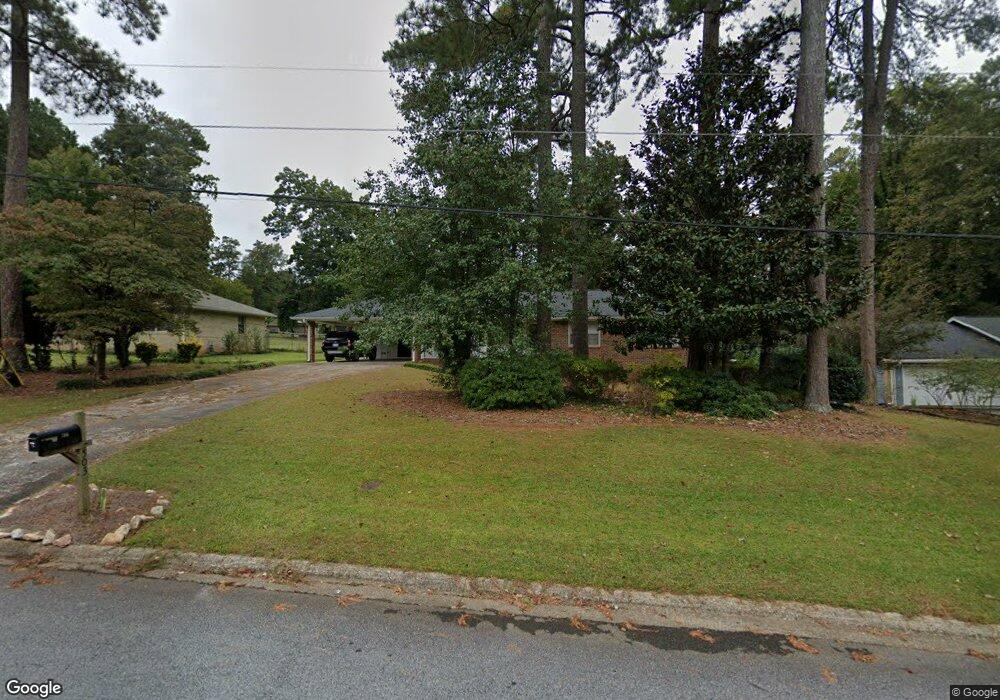
503 Ben Ave SW Lilburn, GA 30047
Estimated Value: $317,000 - $355,000
3
Beds
2
Baths
1,621
Sq Ft
$211/Sq Ft
Est. Value
About This Home
This home is located at 503 Ben Ave SW, Lilburn, GA 30047 and is currently estimated at $341,735, approximately $210 per square foot. 503 Ben Ave SW is a home located in Gwinnett County with nearby schools including Knight Elementary School, Trickum Middle School, and Parkview High School.
Ownership History
Date
Name
Owned For
Owner Type
Purchase Details
Closed on
Dec 14, 2021
Sold by
Ake Jeff M
Bought by
Ake Investment Properties Llc
Current Estimated Value
Purchase Details
Closed on
Sep 25, 2007
Sold by
Lasalle Bk Series 2005-He9
Bought by
Ake Jeff M
Home Financials for this Owner
Home Financials are based on the most recent Mortgage that was taken out on this home.
Original Mortgage
$148,000
Interest Rate
6.49%
Purchase Details
Closed on
Jul 3, 2007
Sold by
Lewis James B
Bought by
Bear Stearns Asset 2005-He9
Purchase Details
Closed on
Jul 14, 2005
Sold by
Rowsey John
Bought by
Lewis James B
Home Financials for this Owner
Home Financials are based on the most recent Mortgage that was taken out on this home.
Original Mortgage
$29,200
Interest Rate
5.59%
Mortgage Type
Stand Alone Refi Refinance Of Original Loan
Create a Home Valuation Report for This Property
The Home Valuation Report is an in-depth analysis detailing your home's value as well as a comparison with similar homes in the area
Home Values in the Area
Average Home Value in this Area
Purchase History
| Date | Buyer | Sale Price | Title Company |
|---|---|---|---|
| Ake Investment Properties Llc | -- | -- | |
| Ake Investment Properties Llc | -- | -- | |
| Ake Jeff M | $135,000 | -- | |
| Bear Stearns Asset 2005-He9 | $126,096 | -- | |
| Lewis James B | $146,000 | -- |
Source: Public Records
Mortgage History
| Date | Status | Borrower | Loan Amount |
|---|---|---|---|
| Previous Owner | Ake Jeff M | $148,000 | |
| Previous Owner | Lewis James B | $29,200 |
Source: Public Records
Tax History Compared to Growth
Tax History
| Year | Tax Paid | Tax Assessment Tax Assessment Total Assessment is a certain percentage of the fair market value that is determined by local assessors to be the total taxable value of land and additions on the property. | Land | Improvement |
|---|---|---|---|---|
| 2025 | $4,715 | $122,320 | $30,000 | $92,320 |
| 2024 | $4,542 | $116,320 | $30,000 | $86,320 |
| 2023 | $4,542 | $118,280 | $25,600 | $92,680 |
| 2022 | $3,076 | $76,000 | $17,600 | $58,400 |
| 2021 | $3,107 | $76,000 | $17,600 | $58,400 |
| 2020 | $3,123 | $79,960 | $17,600 | $62,360 |
| 2019 | $2,964 | $74,680 | $17,600 | $57,080 |
| 2018 | $2,667 | $66,560 | $14,400 | $52,160 |
| 2016 | $2,214 | $53,120 | $14,400 | $38,720 |
| 2015 | $1,976 | $45,800 | $8,000 | $37,800 |
| 2014 | -- | $45,800 | $8,000 | $37,800 |
Source: Public Records
Map
Nearby Homes
- 551 Killian Hill Rd SW
- 478 Dorsey Cir SW
- 383 Ben Ave SW
- 445 Bruce Way SW
- 4406 Hale Dr SW
- 4358 Louis Rd SW
- 676 Killian Hill Rd SW
- 453 James St SW
- 565 James St SW Unit 10
- Oxford Plan at The Preserve at Killian Hill - Townhomes
- 4307 Cedar Wood Dr SW
- 246 Round Pond Dr
- 156 Round Pond Dr
- 4367 Cedar Wood Dr SW
- 4245 Cedar Creek Trail SW
- 4567 Town Crier Rd SW
- 4239 River Branch Way
- 4254 Cedar Creek Trail SW Unit 8
- 493 Ben Ave SW
- 513 Ben Ave SW Unit 4
- 523 Ben Ave SW Unit 4
- 483 Ben Ave SW Unit 5
- 510 Killian Hill Rd SW
- 500 Killian Hill Rd SW
- 520 Killian Hill Rd SW Unit 2
- 520 Killian Hill Rd SW
- 490 Killian Hill Rd SW
- 502 Ben Ave SW Unit 4
- 4292 Theresa Way SW
- 492 Ben Ave SW
- 473 Ben Ave SW
- 533 Ben Ave SW Unit 4
- 480 Killian Hill Rd SW
- 482 Ben Ave SW
- 530 Killian Hill Rd SW
- 463 Ben Ave SW
- 472 Ben Ave SW