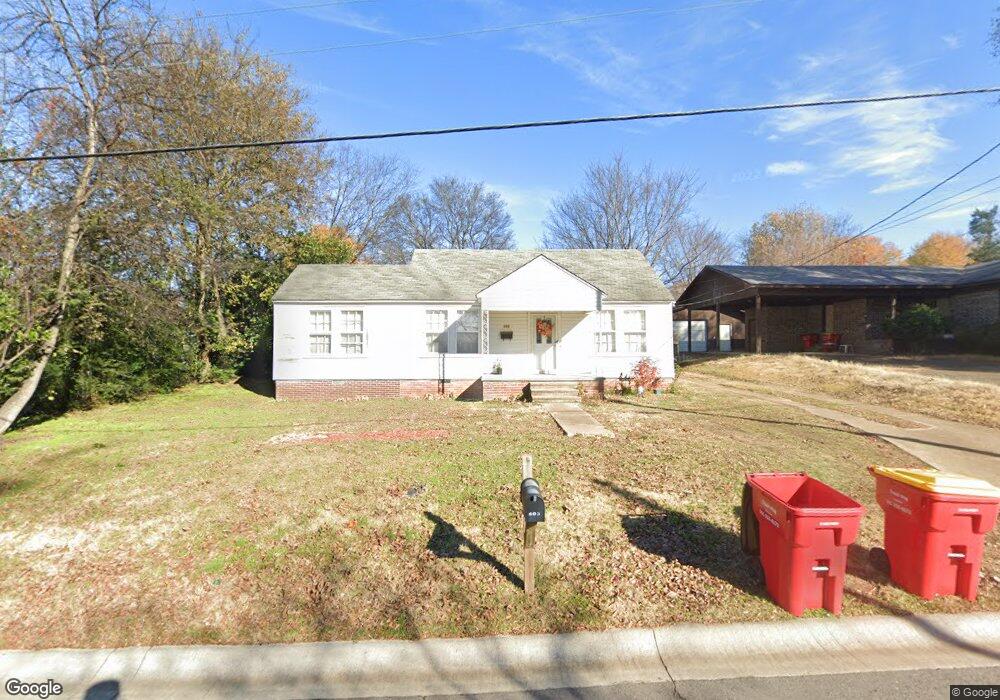
503 Branch St Morrilton, AR 72110
Estimated Value: $57,000 - $92,000
2
Beds
1
Bath
1,004
Sq Ft
$82/Sq Ft
Est. Value
About This Home
This home is located at 503 Branch St, Morrilton, AR 72110 and is currently estimated at $82,791, approximately $82 per square foot. 503 Branch St is a home located in Conway County with nearby schools including Morrilton Primary School, Morrilton Elementary School, and Morrilton Intermediate School.
Ownership History
Date
Name
Owned For
Owner Type
Purchase Details
Closed on
Jul 11, 2022
Sold by
Metz James and Metz Jean
Bought by
Deluca Properties Llc
Current Estimated Value
Purchase Details
Closed on
Sep 10, 2019
Sold by
Terrill Joe and Regions Bank
Bought by
Metz James and Metz Jean
Home Financials for this Owner
Home Financials are based on the most recent Mortgage that was taken out on this home.
Original Mortgage
$12,800
Interest Rate
3.7%
Mortgage Type
Commercial
Purchase Details
Closed on
Jul 11, 2007
Sold by
Daven James M
Bought by
Glenn Vickie
Purchase Details
Closed on
Mar 26, 1996
Bought by
Burcham Monty and Donna Sue
Purchase Details
Closed on
Jan 12, 1994
Bought by
Smith Donna
Purchase Details
Closed on
Jan 25, 1993
Bought by
Deeter Gordon Samuel and Lee Ann
Purchase Details
Closed on
Jan 1, 1984
Bought by
Reidmiller Julia
Create a Home Valuation Report for This Property
The Home Valuation Report is an in-depth analysis detailing your home's value as well as a comparison with similar homes in the area
Home Values in the Area
Average Home Value in this Area
Purchase History
| Date | Buyer | Sale Price | Title Company |
|---|---|---|---|
| Deluca Properties Llc | $41,000 | Yates Howard C | |
| Metz James | $16,000 | Morrilton Abstract Co Inc | |
| Glenn Vickie | -- | -- | |
| Burcham Monty | -- | -- | |
| Smith Donna | $21,700 | -- | |
| Deeter Gordon Samuel | -- | -- | |
| Deeter Gordon Samuel | -- | -- | |
| Osterlink Frank A | -- | -- | |
| Reidmiller Julia | -- | -- |
Source: Public Records
Mortgage History
| Date | Status | Borrower | Loan Amount |
|---|---|---|---|
| Previous Owner | Metz James | $12,800 | |
| Previous Owner | Reidmiller Julia | $0 |
Source: Public Records
Tax History Compared to Growth
Tax History
| Year | Tax Paid | Tax Assessment Tax Assessment Total Assessment is a certain percentage of the fair market value that is determined by local assessors to be the total taxable value of land and additions on the property. | Land | Improvement |
|---|---|---|---|---|
| 2024 | $479 | $8,850 | $1,400 | $7,450 |
| 2023 | $479 | $8,850 | $1,400 | $7,450 |
| 2022 | $24 | $8,850 | $1,400 | $7,450 |
| 2021 | $5 | $7,020 | $1,410 | $5,610 |
| 2020 | $380 | $7,020 | $1,410 | $5,610 |
| 2019 | $380 | $7,020 | $1,410 | $5,610 |
| 2018 | $30 | $7,020 | $1,410 | $5,610 |
| 2017 | $30 | $7,020 | $1,410 | $5,610 |
| 2016 | $0 | $7,040 | $1,410 | $5,630 |
| 2015 | -- | $7,040 | $1,410 | $5,630 |
| 2014 | -- | $7,040 | $1,410 | $5,630 |
Source: Public Records
Map
Nearby Homes
- 304 N Saint Joseph St
- 500 S Moose St
- 38 Sunset Blvd
- 7 Sunset Blvd
- 705 E Commerce St
- 311 N Will St
- 603 N Division St
- 111 E Commerce St
- 407 N Oak St
- 402 N Morrill St
- 200 N Morrill St
- 1207 E Rock St
- 607 Branch St
- 303 S Saint Joseph St
- 601 Green St
- 9 E Harding St
- 605 N West St
- 202 N Griffin St
- 707 N West St
- 116 Lane St
- 509 Branch St
- 500 Saint John St
- 504 Saint John St
- 505 Saint Vincent St
- 501 Saint Vincent St
- 502 Branch St
- 411 Branch St
- 507 Saint Vincent St
- 510 Saint John St
- 505 Saint John St
- 508 Branch St
- 500 Branch St
- 510E Conway St
- 410 Conway St
- 510 Conway St
- 407 Branch St
- 408 Branch St
- 503 E Conway St
- 601 Branch St
- 408 Conway St