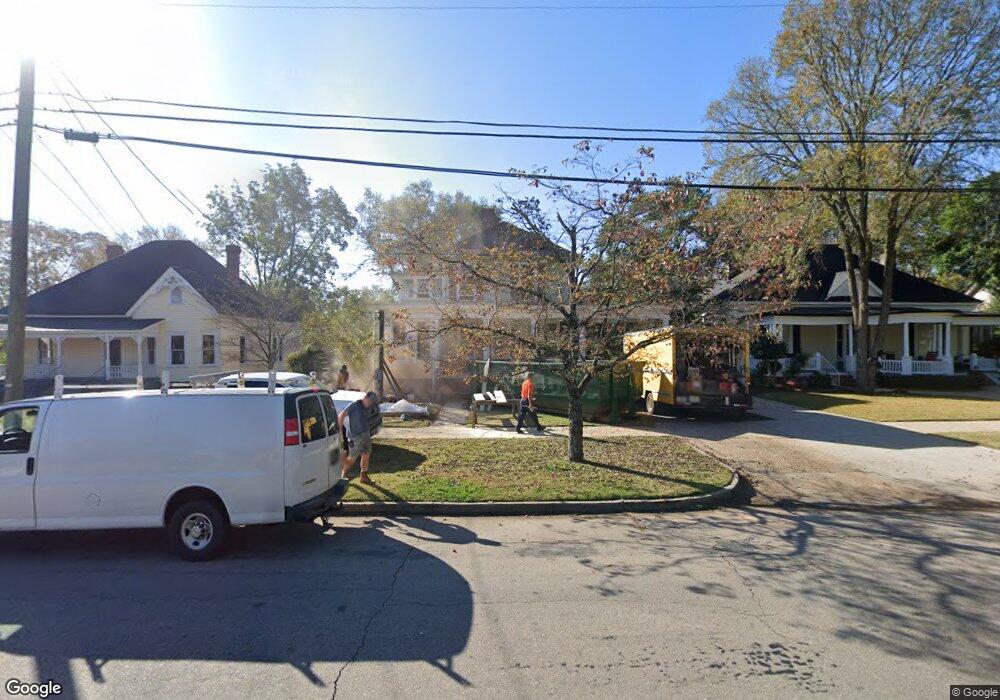
503 Broad St Lagrange, GA 30240
Estimated Value: $285,000 - $430,000
3
Beds
2
Baths
2,352
Sq Ft
$147/Sq Ft
Est. Value
About This Home
This home is located at 503 Broad St, Lagrange, GA 30240 and is currently estimated at $346,344, approximately $147 per square foot. 503 Broad St is a home located in Troup County with nearby schools including Hollis Hand Elementary School, Ethel W. Kight Elementary School, and Franklin Forest Elementary School.
Ownership History
Date
Name
Owned For
Owner Type
Purchase Details
Closed on
May 26, 2023
Sold by
Livingston Joseph Stephen
Bought by
Myers Robert T and Myers Diana B
Current Estimated Value
Purchase Details
Closed on
Jan 8, 2021
Sold by
Pulver Margaret M
Bought by
Livingston Joseph Stephen and Livingston Breanna Lee
Home Financials for this Owner
Home Financials are based on the most recent Mortgage that was taken out on this home.
Original Mortgage
$160,550
Interest Rate
2.71%
Mortgage Type
New Conventional
Purchase Details
Closed on
Jun 10, 1977
Sold by
Joyce C Barnwell
Bought by
Pulver Edward J and Pulver Margaret M
Purchase Details
Closed on
Jan 1, 1976
Sold by
Layfield Robert F
Bought by
Joyce C Barnwell
Purchase Details
Closed on
Jun 1, 1975
Sold by
Baughdrill Baughdrill J and Baughdrill Louise
Bought by
Layfield Robert F
Purchase Details
Closed on
Jun 1, 1966
Sold by
Whatley Whatley E and Whatley Martha
Bought by
Baughdrill Baughdrill J and Baughdrill Louise
Create a Home Valuation Report for This Property
The Home Valuation Report is an in-depth analysis detailing your home's value as well as a comparison with similar homes in the area
Purchase History
| Date | Buyer | Sale Price | Title Company |
|---|---|---|---|
| Myers Robert T | $255,000 | -- | |
| Livingston Joseph Stephen | $169,000 | -- | |
| Pulver Edward J | $46,000 | -- | |
| Joyce C Barnwell | -- | -- | |
| Layfield Robert F | $37,200 | -- | |
| Baughdrill Baughdrill J | -- | -- |
Source: Public Records
Mortgage History
| Date | Status | Borrower | Loan Amount |
|---|---|---|---|
| Previous Owner | Livingston Joseph Stephen | $160,550 |
Source: Public Records
Tax History
| Year | Tax Paid | Tax Assessment Tax Assessment Total Assessment is a certain percentage of the fair market value that is determined by local assessors to be the total taxable value of land and additions on the property. | Land | Improvement |
|---|---|---|---|---|
| 2025 | $4,954 | $181,640 | $11,960 | $169,680 |
| 2024 | $3,499 | $128,280 | $11,960 | $116,320 |
| 2023 | $3,416 | $125,240 | $11,960 | $113,280 |
| 2022 | $3,271 | $117,200 | $11,960 | $105,240 |
| 2021 | $2,915 | $96,640 | $11,960 | $84,680 |
| 2020 | $2,915 | $96,640 | $11,960 | $84,680 |
| 2019 | $2,154 | $73,400 | $11,960 | $61,440 |
| 2018 | $1,709 | $58,660 | $11,340 | $47,320 |
| 2017 | $1,709 | $58,660 | $11,340 | $47,320 |
| 2016 | $1,659 | $56,990 | $11,340 | $45,650 |
| 2015 | $1,681 | $57,616 | $11,966 | $45,650 |
| 2014 | $1,611 | $55,213 | $11,966 | $43,247 |
| 2013 | -- | $58,170 | $12,020 | $46,150 |
Source: Public Records
Map
Nearby Homes
- 208 Boulevard
- 598 Edmondson Ave
- 119 College Ave
- 405 W Broome St Unit 2
- 405 W Broome St Unit 3
- 405 W Broome St Unit 4
- 405 W Broome St Unit 1
- 405 W Broome St Unit 5
- 304 Boulevard
- 203 Waverly Way
- 206 Broad St
- 105 Saynor Cir
- 416 Park Ave
- 421 College Ave
- 216 E Lane Cir
- 120 Saynor Cir
- 505 S Lewis St
- 207 Wilkes St
- 509 S Lewis St
- 217 Jefferson St
- 505 Broad St
- 501 Broad St
- 602 Vernon St
- 600 Vernon St
- 507 Broad St
- 413 Broad St
- 500 Broad St
- 562 Broad St
- 502 Broad St
- 601 Vernon St
- 504 Broad St Unit 1
- 504 Broad St Unit 4
- 504 Broad St Unit 2
- 504 Broad St Unit 5
- 504 Broad St Unit 3
- 504 Broad St Unit 1
- 411 Broad St
- 506 Vernon St
- 574 Broad St
- 566 Broad St
Your Personal Tour Guide
Ask me questions while you tour the home.