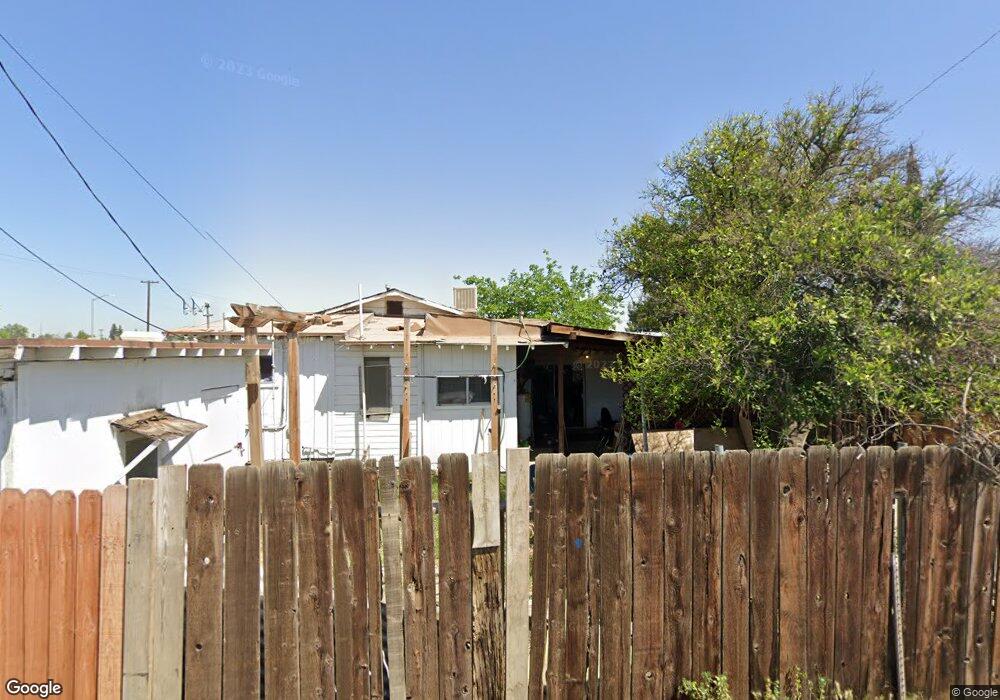
503 Butte St Bakersfield, CA 93305
East Bakersfield NeighborhoodEstimated Value: $204,000 - $286,000
2
Beds
1
Bath
584
Sq Ft
$406/Sq Ft
Est. Value
About This Home
This home is located at 503 Butte St, Bakersfield, CA 93305 and is currently estimated at $236,949, approximately $405 per square foot. 503 Butte St is a home located in Kern County with nearby schools including Compton Junior High School, Bakersfield High School, and Our Lady Of Guadalupe.
Ownership History
Date
Name
Owned For
Owner Type
Purchase Details
Closed on
Oct 3, 2016
Sold by
Martinez Steve and Theodore Martinez Revocable Tr
Bought by
Montes Edith
Current Estimated Value
Home Financials for this Owner
Home Financials are based on the most recent Mortgage that was taken out on this home.
Original Mortgage
$60,877
Outstanding Balance
$50,516
Interest Rate
4.62%
Mortgage Type
FHA
Estimated Equity
$186,433
Purchase Details
Closed on
Feb 1, 2016
Sold by
Martinez Theodore
Bought by
Martinez Theodore and The Theodore Martinez Revocabl
Create a Home Valuation Report for This Property
The Home Valuation Report is an in-depth analysis detailing your home's value as well as a comparison with similar homes in the area
Home Values in the Area
Average Home Value in this Area
Purchase History
We collect this data history from publicly available records. To have your information removed, we recommend requesting removal directly through your county’s website.
| Date | Buyer | Sale Price | Title Company |
|---|---|---|---|
| Montes Edith | $62,000 | Placer Title Company | |
| Martinez Theodore | -- | None Available |
Source: Public Records
Mortgage History
We collect this data history from publicly available records. To have your information removed, we recommend requesting removal directly through your county’s website.
| Date | Status | Borrower | Loan Amount |
|---|---|---|---|
| Open | Montes Edith | $60,877 |
Source: Public Records
Tax History
| Year | Tax Paid | Tax Assessment Tax Assessment Total Assessment is a certain percentage of the fair market value that is determined by local assessors to be the total taxable value of land and additions on the property. | Land | Improvement |
|---|---|---|---|---|
| 2025 | $1,455 | $71,949 | $34,815 | $37,134 |
| 2024 | $1,416 | $70,539 | $34,133 | $36,406 |
| 2023 | $1,416 | $69,157 | $33,464 | $35,693 |
| 2022 | $1,368 | $67,802 | $32,808 | $34,994 |
| 2021 | $1,269 | $66,473 | $32,165 | $34,308 |
| 2020 | $1,234 | $65,793 | $31,836 | $33,957 |
| 2019 | $1,209 | $65,793 | $31,836 | $33,957 |
| 2018 | $1,183 | $63,240 | $30,600 | $32,640 |
| 2017 | $1,171 | $62,000 | $30,000 | $32,000 |
| 2016 | $604 | $16,672 | $5,873 | $10,799 |
| 2015 | $592 | $16,422 | $5,785 | $10,637 |
| 2014 | $573 | $16,101 | $5,672 | $10,429 |
Source: Public Records
Map
Nearby Homes
Your Personal Tour Guide
Ask me questions while you tour the home.