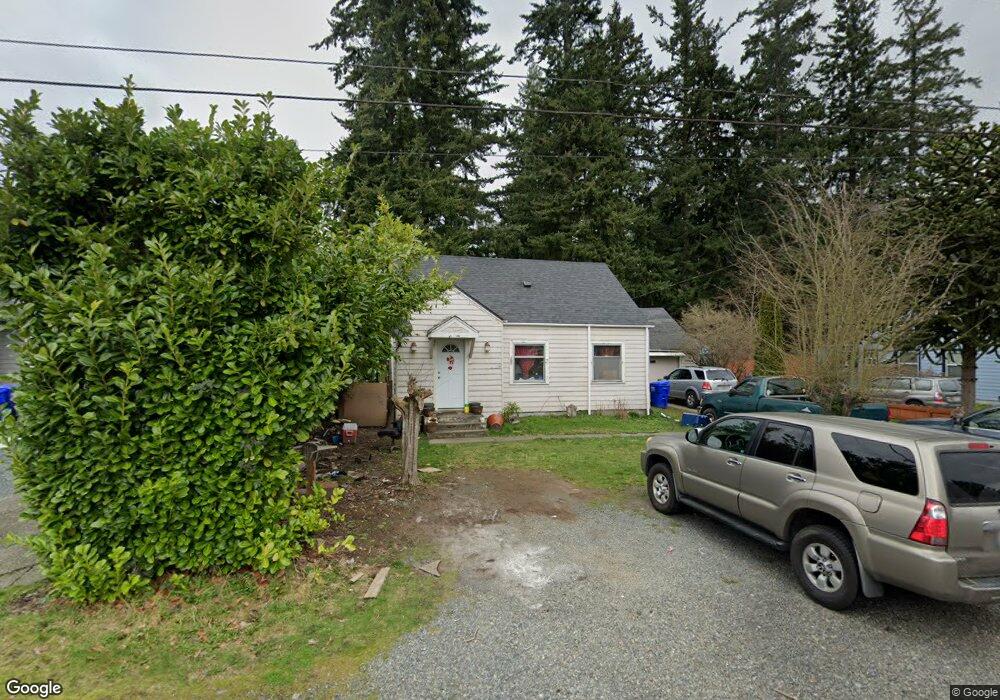
503 Cabot Rd Everett, WA 98203
Evergreen NeighborhoodEstimated Value: $497,000 - $524,666
3
Beds
1
Bath
992
Sq Ft
$519/Sq Ft
Est. Value
About This Home
This home is located at 503 Cabot Rd, Everett, WA 98203 and is currently estimated at $514,667, approximately $518 per square foot. 503 Cabot Rd is a home located in Snohomish County with nearby schools including Madison Elementary School, Evergreen Middle School, and Cascade High School.
Ownership History
Date
Name
Owned For
Owner Type
Purchase Details
Closed on
Dec 6, 2005
Sold by
Zdenek Nathan
Bought by
Luna Elias
Current Estimated Value
Home Financials for this Owner
Home Financials are based on the most recent Mortgage that was taken out on this home.
Original Mortgage
$225,550
Outstanding Balance
$122,263
Interest Rate
6.36%
Mortgage Type
Fannie Mae Freddie Mac
Estimated Equity
$392,405
Purchase Details
Closed on
Aug 28, 2001
Sold by
Mckoon Samuel and Mckoon Darleen
Bought by
Mckoon Steven H and Mckoon Lori A
Home Financials for this Owner
Home Financials are based on the most recent Mortgage that was taken out on this home.
Original Mortgage
$152,791
Interest Rate
7.21%
Mortgage Type
FHA
Purchase Details
Closed on
Aug 14, 2001
Sold by
Green Lori and Mckoon Lori Ann
Bought by
Zdenek Nathan
Home Financials for this Owner
Home Financials are based on the most recent Mortgage that was taken out on this home.
Original Mortgage
$152,791
Interest Rate
7.21%
Mortgage Type
FHA
Create a Home Valuation Report for This Property
The Home Valuation Report is an in-depth analysis detailing your home's value as well as a comparison with similar homes in the area
Home Values in the Area
Average Home Value in this Area
Purchase History
| Date | Buyer | Sale Price | Title Company |
|---|---|---|---|
| Luna Elias | $225,570 | Chicago Title | |
| Mckoon Steven H | -- | -- | |
| Zdenek Nathan | $154,950 | Evergreen Title Company Inc |
Source: Public Records
Mortgage History
| Date | Status | Borrower | Loan Amount |
|---|---|---|---|
| Open | Luna Elias | $225,550 | |
| Previous Owner | Zdenek Nathan | $152,791 |
Source: Public Records
Tax History
| Year | Tax Paid | Tax Assessment Tax Assessment Total Assessment is a certain percentage of the fair market value that is determined by local assessors to be the total taxable value of land and additions on the property. | Land | Improvement |
|---|---|---|---|---|
| 2026 | $4,010 | $483,400 | $380,000 | $103,400 |
| 2025 | $3,701 | $458,800 | $360,000 | $98,800 |
| 2024 | $3,701 | $429,800 | $331,000 | $98,800 |
| 2023 | $3,826 | $464,700 | $356,000 | $108,700 |
| 2022 | $3,291 | $358,600 | $262,000 | $96,600 |
| 2020 | $3,288 | $292,200 | $205,000 | $87,200 |
| 2019 | $3,040 | $271,900 | $186,000 | $85,900 |
| 2018 | $2,997 | $245,800 | $168,000 | $77,800 |
| 2017 | $2,621 | $214,100 | $144,000 | $70,100 |
| 2016 | $2,124 | $182,300 | $118,000 | $64,300 |
| 2015 | $1,994 | $161,200 | $105,000 | $56,200 |
| 2013 | $1,835 | $130,900 | $80,000 | $50,900 |
Source: Public Records
Map
Nearby Homes
- 627 Madison St
- 6916 Beverly Ln
- 820 E Cady Rd Unit A304
- 6705 Cady Rd
- 820 Cady Rd Unit H203
- 820 Cady Rd Unit H304
- 820 Cady Rd Unit H101
- 820 Cady Rd Unit B305
- 820 Cady Rd Unit F103
- 6518 Cady Rd
- 747 75th St SE Unit B203
- 615 75th St SE Unit C53
- 615 75th St SE Unit C52
- 323 75th St SE Unit A14
- 323 75th St SE Unit B10
- 7027 Rainier Dr Unit E
- 7027 Rainier Dr Unit G
- 7027 Rainier Dr Unit A
- 6303 Cady Rd
- 6302 Fleming St
Your Personal Tour Guide
Ask me questions while you tour the home.