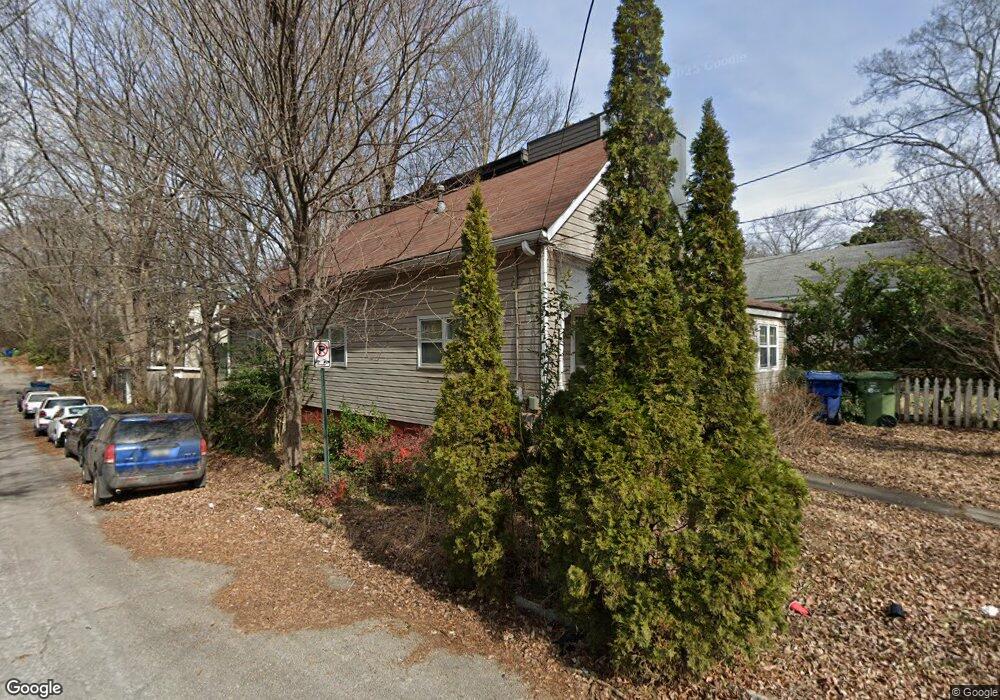
503 Calhoun St NW Atlanta, GA 30318
Home Park NeighborhoodEstimated Value: $451,085 - $726,000
2
Beds
2
Baths
1,084
Sq Ft
$540/Sq Ft
Est. Value
About This Home
This home is located at 503 Calhoun St NW, Atlanta, GA 30318 and is currently estimated at $585,771, approximately $540 per square foot. 503 Calhoun St NW is a home located in Fulton County with nearby schools including Midtown High School, Centennial Academy, and KIPP WAYS Academy.
Ownership History
Date
Name
Owned For
Owner Type
Purchase Details
Closed on
Sep 28, 2009
Sold by
Shumaker Nicole Y
Bought by
Sanders Daniel P and Sanders Phaleiny H
Current Estimated Value
Purchase Details
Closed on
Jul 26, 2002
Sold by
Kelly Frank L
Bought by
Shumaker Nichole Y
Home Financials for this Owner
Home Financials are based on the most recent Mortgage that was taken out on this home.
Original Mortgage
$180,000
Interest Rate
6.52%
Mortgage Type
New Conventional
Purchase Details
Closed on
Jun 25, 1999
Sold by
Kelly Lawrence P
Bought by
Kelly Frank L
Purchase Details
Closed on
Jul 31, 1998
Sold by
Spokes Christine
Bought by
Carter Cheryl A
Home Financials for this Owner
Home Financials are based on the most recent Mortgage that was taken out on this home.
Original Mortgage
$116,000
Interest Rate
6.37%
Mortgage Type
New Conventional
Purchase Details
Closed on
Apr 30, 1998
Sold by
Fiveash Charlie M and Fiveash Cyrus
Bought by
Spokes Christine
Create a Home Valuation Report for This Property
The Home Valuation Report is an in-depth analysis detailing your home's value as well as a comparison with similar homes in the area
Home Values in the Area
Average Home Value in this Area
Purchase History
| Date | Buyer | Sale Price | Title Company |
|---|---|---|---|
| Sanders Daniel P | $257,000 | -- | |
| Shumaker Nichole Y | $225,000 | -- | |
| Kelly Frank L | -- | -- | |
| Kelly Lawrence P | $179,900 | -- | |
| Carter Cheryl A | $145,000 | -- | |
| Spokes Christine | $74,000 | -- |
Source: Public Records
Mortgage History
| Date | Status | Borrower | Loan Amount |
|---|---|---|---|
| Previous Owner | Shumaker Nichole Y | $180,000 | |
| Previous Owner | Carter Cheryl A | $116,000 | |
| Closed | Spokes Christine | $0 |
Source: Public Records
Tax History Compared to Growth
Tax History
| Year | Tax Paid | Tax Assessment Tax Assessment Total Assessment is a certain percentage of the fair market value that is determined by local assessors to be the total taxable value of land and additions on the property. | Land | Improvement |
|---|---|---|---|---|
| 2025 | $4,819 | $163,920 | $74,920 | $89,000 |
| 2023 | $6,026 | $145,560 | $44,560 | $101,000 |
| 2022 | $5,891 | $145,560 | $44,560 | $101,000 |
| 2021 | $6,013 | $136,400 | $55,200 | $81,200 |
| 2020 | $5,260 | $128,400 | $60,240 | $68,160 |
| 2019 | $480 | $96,800 | $59,160 | $37,640 |
| 2018 | $3,069 | $102,520 | $22,920 | $79,600 |
| 2017 | $3,201 | $74,120 | $21,200 | $52,920 |
| 2016 | $3,209 | $74,120 | $21,200 | $52,920 |
| 2015 | $3,667 | $74,120 | $21,200 | $52,920 |
| 2014 | $3,361 | $74,120 | $21,200 | $52,920 |
Source: Public Records
Map
Nearby Homes
- 504 Calhoun St NW
- 1072 Mcmillan St NW
- 455 Lynch Ave NW
- 1052 Curran St NW
- 991 Hampton St NW
- 1008 State St NW
- 1041 State St NW Unit 23
- 1031 State St NW Unit 106
- 691 Vidalia Ln NW
- 395 Laurent St NW Unit 4
- Townhouse with Rooftop Deck Plan at Interlock
- 400 17th St NW Unit 2407
- 400 17th St NW Unit 2212
- 400 17th St NW Unit 2435
- 400 17th St NW Unit 1113
- 400 17th St NW Unit 1151
- 499 Calhoun St NW
- 511 Calhoun St NW
- 495 Calhoun St NW
- 515 Calhoun St NW Unit B
- 515 Calhoun St NW
- 1055 Mcmillan St NW
- 1059 Terrell St NW
- 1046 Center St NW
- 1042 Center St NW
- 504 Calhoun St NW Unit B
- 496 Calhoun St NW
- 1052 Center St NW
- 492 Calhoun St NW
- 512 Calhoun St NW
- 1056 Center St NW
- 1065 Terrell St NW
- 516 Calhoun St NW
- 1062 Center St NW
- 486 Calhoun St NW
- 1065 Mcmillan St NW