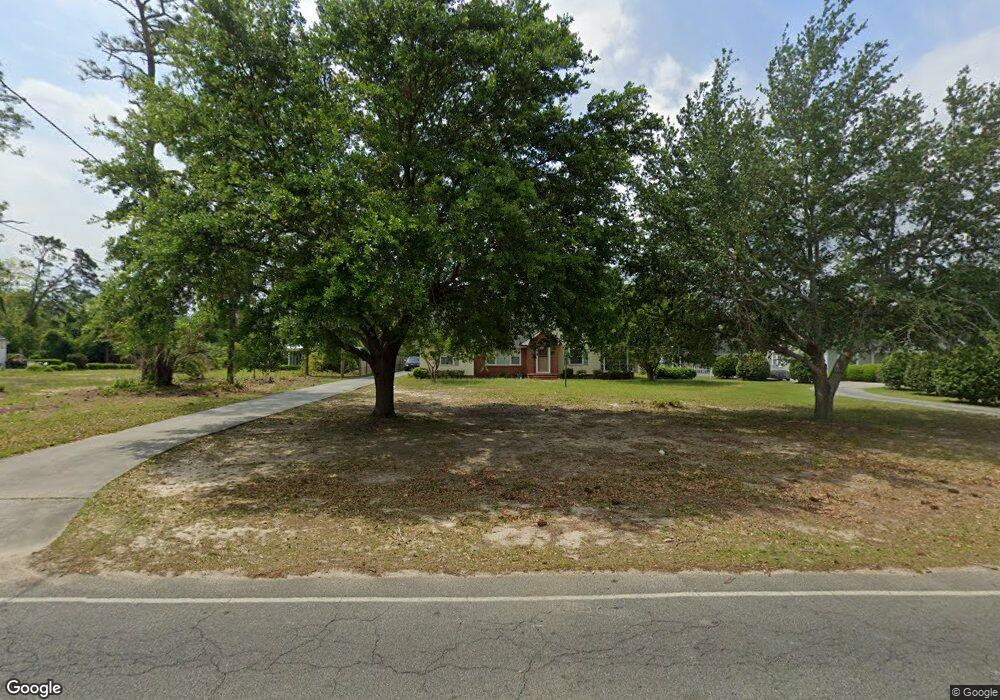
503 Chester Ave N Douglas, GA 31533
Estimated Value: $173,000 - $262,000
--
Bed
2
Baths
2,004
Sq Ft
$105/Sq Ft
Est. Value
About This Home
This home is located at 503 Chester Ave N, Douglas, GA 31533 and is currently estimated at $210,641, approximately $105 per square foot. 503 Chester Ave N is a home located in Coffee County with nearby schools including Westside Elementary School, Coffee Middle School, and Coffee County High School.
Ownership History
Date
Name
Owned For
Owner Type
Purchase Details
Closed on
May 2, 2016
Sold by
Deal Johnny D
Bought by
Sutliff Jeffrey M and Sutliff Patricia D
Current Estimated Value
Home Financials for this Owner
Home Financials are based on the most recent Mortgage that was taken out on this home.
Original Mortgage
$114,570
Outstanding Balance
$91,354
Interest Rate
3.71%
Mortgage Type
New Conventional
Estimated Equity
$119,287
Purchase Details
Closed on
Jun 30, 2015
Sold by
Knowles Andrew Thomas
Bought by
Deal Johnny D
Purchase Details
Closed on
Jan 20, 2014
Sold by
Knowles Andrew Thomas
Bought by
Knowles Knowles Andrew Thomas Andrew Thomas and Knowles Mathews Lucinda
Purchase Details
Closed on
Mar 9, 2010
Sold by
Estate Of Dora Elizabeth Knowles
Bought by
Knowles George Thomas
Create a Home Valuation Report for This Property
The Home Valuation Report is an in-depth analysis detailing your home's value as well as a comparison with similar homes in the area
Home Values in the Area
Average Home Value in this Area
Purchase History
| Date | Buyer | Sale Price | Title Company |
|---|---|---|---|
| Sutliff Jeffrey M | $120,600 | -- | |
| Deal Johnny D | $70,000 | -- | |
| Knowles Knowles Andrew Thomas Andrew Thomas | -- | -- | |
| Knowles George Thomas | -- | -- |
Source: Public Records
Mortgage History
| Date | Status | Borrower | Loan Amount |
|---|---|---|---|
| Open | Sutliff Jeffrey M | $114,570 |
Source: Public Records
Tax History Compared to Growth
Tax History
| Year | Tax Paid | Tax Assessment Tax Assessment Total Assessment is a certain percentage of the fair market value that is determined by local assessors to be the total taxable value of land and additions on the property. | Land | Improvement |
|---|---|---|---|---|
| 2024 | $1,261 | $43,139 | $7,020 | $36,119 |
| 2023 | $690 | $43,139 | $7,020 | $36,119 |
| 2022 | $1,360 | $43,139 | $7,020 | $36,119 |
| 2021 | $1,360 | $43,139 | $7,020 | $36,119 |
| 2020 | $1,362 | $43,139 | $7,020 | $36,119 |
| 2019 | $1,362 | $43,139 | $7,020 | $36,119 |
| 2018 | $1,362 | $43,139 | $7,020 | $36,119 |
| 2017 | $1,416 | $43,139 | $7,020 | $36,119 |
| 2016 | $920 | $43,139 | $7,020 | $36,119 |
| 2015 | $1,425 | $43,139 | $7,020 | $36,119 |
| 2014 | $1,430 | $43,139 | $7,020 | $36,119 |
Source: Public Records
Map
Nearby Homes
- 823 Grady Ave N
- 904 Chester Ave N
- 907 Chester Ave N
- 00 Georgia Highway 32
- 406-403 Ward Street & Ashley St
- 804 W Ashley St
- 1602 Ward Street Extension W
- 105 Jackson St
- 242 Eagle Cir
- 309 Schley St E
- 302 Touchton Dr
- 00 Highway 32 West Bowens Mill Rd
- 315 E Sellers St
- 405 Peachtree St E
- 1804 Meadowlark Ln
- 1811 Coffee Rd
- 1809 Coffee Rd
- 1320 W Ocilla Hwy ( Hwy 32 West)
- 204 Gaskin Ave N
- 514 Schley St E
- 501 N Chester Ave
- 505 Chester Ave N
- 411 Chester Ave N
- 601 Chester Ave N
- 409 Chester Ave N
- 506 Chester Ave N
- 506 Chester Ave N
- 506 Chester Ave N
- 512 Chester Ave N
- 603 Chester Ave N
- 502 Chester Ave N Unit 1
- 502 Chester Ave N
- 407 Chester Ave N
- 408 N Chester Ave
- 600 Chester Ave N Unit 1
- 600 Chester Ave N
- 406 N Chester Ave
- 403 Chester Ave N
- 403 N Chester Ave
- 605 Chester Ave N