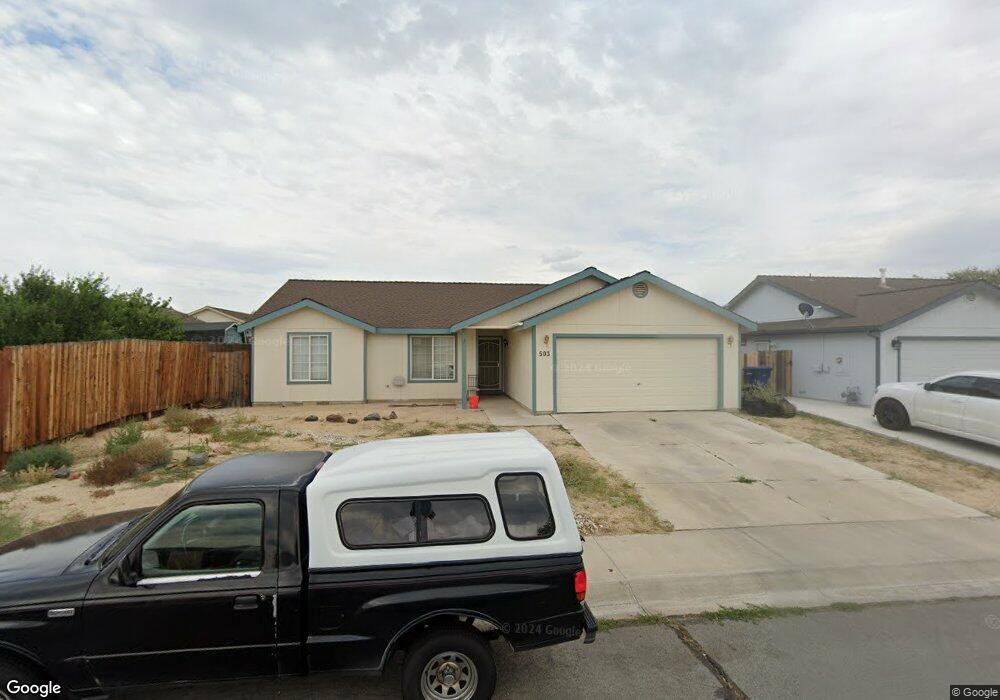
503 Chuck Wagon Ln Fernley, NV 89408
Estimated Value: $341,171 - $354,000
3
Beds
2
Baths
1,355
Sq Ft
$259/Sq Ft
Est. Value
About This Home
This home is located at 503 Chuck Wagon Ln, Fernley, NV 89408 and is currently estimated at $350,293, approximately $258 per square foot. 503 Chuck Wagon Ln is a home located in Lyon County with nearby schools including East Valley Elementary School, Fernley Intermediate School, and Fernley High School.
Ownership History
Date
Name
Owned For
Owner Type
Purchase Details
Closed on
Oct 4, 2020
Sold by
High Country Homes Llc
Bought by
Anderson Michael J and Anderson Carey L
Current Estimated Value
Purchase Details
Closed on
May 2, 2005
Sold by
High Country Homes Llc
Bought by
High Country Homes Llc
Create a Home Valuation Report for This Property
The Home Valuation Report is an in-depth analysis detailing your home's value as well as a comparison with similar homes in the area
Home Values in the Area
Average Home Value in this Area
Purchase History
| Date | Buyer | Sale Price | Title Company |
|---|---|---|---|
| Anderson Michael J | -- | None Available | |
| High Country Homes Llc | -- | Accommodation |
Source: Public Records
Tax History Compared to Growth
Tax History
| Year | Tax Paid | Tax Assessment Tax Assessment Total Assessment is a certain percentage of the fair market value that is determined by local assessors to be the total taxable value of land and additions on the property. | Land | Improvement |
|---|---|---|---|---|
| 2025 | $1,436 | $97,707 | $43,750 | $53,957 |
| 2024 | $1,739 | $98,126 | $43,750 | $54,375 |
| 2023 | $1,739 | $94,680 | $43,750 | $50,930 |
| 2022 | $1,584 | $90,766 | $43,750 | $47,016 |
| 2021 | $1,575 | $80,509 | $34,650 | $45,859 |
| 2020 | $1,536 | $78,547 | $34,650 | $43,897 |
| 2019 | $1,520 | $73,878 | $31,500 | $42,378 |
| 2018 | $1,491 | $62,331 | $21,000 | $41,331 |
| 2017 | $1,492 | $54,466 | $13,130 | $41,336 |
| 2016 | $1,310 | $41,641 | $5,780 | $35,861 |
| 2015 | $1,345 | $32,920 | $5,780 | $27,140 |
| 2014 | $1,317 | $25,370 | $5,780 | $19,590 |
Source: Public Records
Map
Nearby Homes
- 863 Jennys Ln
- 870 Jennys Ln
- 1494 Mountain Rose Dr
- 698 Jenny's Ln
- 675 Warren Way
- 1844 Fort Sutter Blvd Unit Lot 5
- 1848 Fort Sutter Blvd Unit Lot 6
- 400 Fort Sutter Blvd
- 357 Emigrant Way
- 4520 Mifflin St Unit Lot 1
- 4531 Mifflin St Unit Lot 28
- Topaz Plan at Nevada Sky
- Tahoe Plan at Nevada Sky
- Washoe Plan at Nevada Sky
- 2119 Fort Bridger Rd
- 4535 Mifflin St Unit Lot 27
- 1224 Mountain Rose Dr
- 123 Shadow Mountain Dr
- 4543 Mifflin St
- 4543 Mifflin St Unit Lot 25
- 1531 Wrangler Ln
- 1537 Wrangler Ln
- 1529 Wrangler Ln
- 1539 Wrangler Ln
- 507 Chuck Wagon Ln
- 502 Chuck Wagon Ln
- 1533 Wrangler Ln
- 1541 Wrangler Ln
- 504 Chuck Wagon Ln
- 509 Chuck Wagon Ln
- 1523 Wrangler Ln
- 510 Chuck Wagon Ln
- 511 Chuck Wagon Ln Unit RIVER RANCH SUBDIVIS
- 511 Chuck Wagon Ln
- 625 Brook Ln
- 1543 Wrangler Ln
- 1606 Meadows Ave
- 1538 Wrangler Ln
- 1604 Meadows Ave
- 1540 Wrangler Ln