Estimated Value: $134,236 - $151,000
2
Beds
1
Bath
1,213
Sq Ft
$116/Sq Ft
Est. Value
About This Home
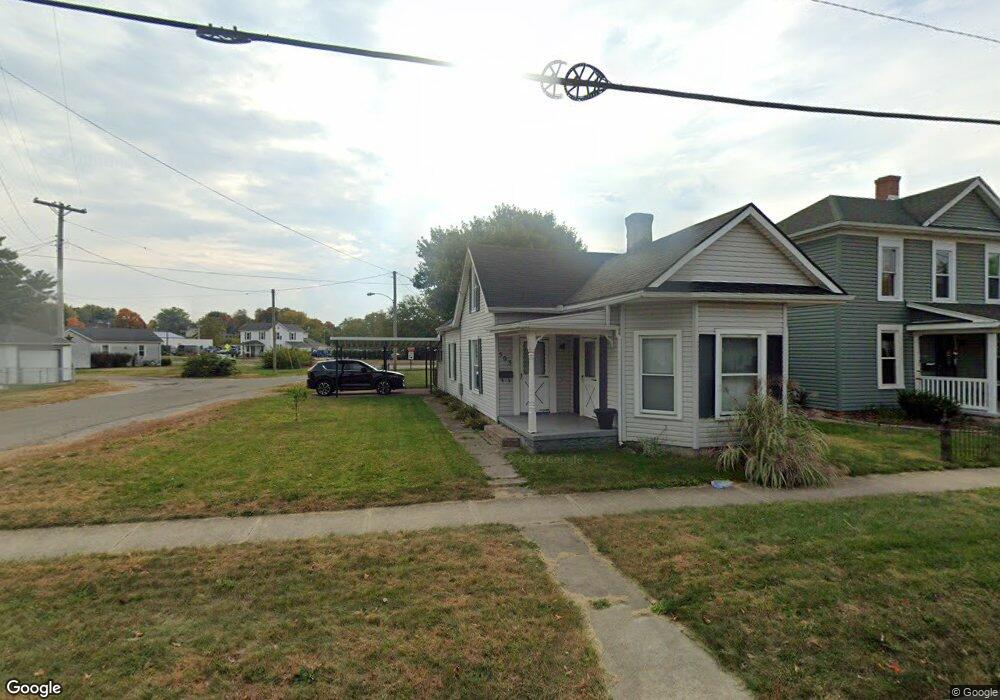
This home is located at 503 Cincinnati Ave, Xenia, OH 45385 and is currently estimated at $141,079, approximately $116 per square foot. 503 Cincinnati Ave is a home located in Greene County with nearby schools including Xenia High School, Summit Academy Community School for Alternative Learners - Xenia, and Legacy Christian Academy.
Ownership History
Date
Name
Owned For
Owner Type
Purchase Details
Closed on
Nov 18, 2019
Sold by
Demko Richard J
Bought by
Demko Christian L
Current Estimated Value
Home Financials for this Owner
Home Financials are based on the most recent Mortgage that was taken out on this home.
Original Mortgage
$34,400
Outstanding Balance
$26,165
Interest Rate
3.6%
Mortgage Type
Future Advance Clause Open End Mortgage
Estimated Equity
$114,914
Purchase Details
Closed on
Oct 10, 2019
Sold by
Smith William Michael and Rose Kelly Luvern
Bought by
Demko Richard J and Demko Christian L
Home Financials for this Owner
Home Financials are based on the most recent Mortgage that was taken out on this home.
Original Mortgage
$34,400
Outstanding Balance
$26,165
Interest Rate
3.6%
Mortgage Type
Future Advance Clause Open End Mortgage
Estimated Equity
$114,914
Purchase Details
Closed on
Aug 7, 2019
Sold by
Estate Of Ida Luvern Smith
Bought by
Smith William Michael and Rose Kelly Luvem
Create a Home Valuation Report for This Property
The Home Valuation Report is an in-depth analysis detailing your home's value as well as a comparison with similar homes in the area
Home Values in the Area
Average Home Value in this Area
Purchase History
| Date | Buyer | Sale Price | Title Company |
|---|---|---|---|
| Demko Christian L | -- | First American Title | |
| Demko Richard J | $43,000 | First American Title | |
| Smith William Michael | -- | None Available |
Source: Public Records
Mortgage History
| Date | Status | Borrower | Loan Amount |
|---|---|---|---|
| Open | Demko Christian L | $34,400 |
Source: Public Records
Tax History
| Year | Tax Paid | Tax Assessment Tax Assessment Total Assessment is a certain percentage of the fair market value that is determined by local assessors to be the total taxable value of land and additions on the property. | Land | Improvement |
|---|---|---|---|---|
| 2025 | $1,229 | $28,220 | $4,520 | $23,700 |
| 2024 | $1,229 | $28,220 | $4,520 | $23,700 |
| 2023 | $1,208 | $28,220 | $4,520 | $23,700 |
| 2022 | $1,062 | $21,170 | $3,620 | $17,550 |
| 2021 | $1,076 | $21,170 | $3,620 | $17,550 |
| 2020 | $1,031 | $21,170 | $3,620 | $17,550 |
| 2019 | $581 | $20,270 | $3,820 | $16,450 |
| 2018 | $583 | $20,270 | $3,820 | $16,450 |
| 2017 | $531 | $20,270 | $3,820 | $16,450 |
| 2016 | $532 | $19,070 | $3,820 | $15,250 |
| 2015 | $267 | $19,070 | $3,820 | $15,250 |
| 2014 | $255 | $19,070 | $3,820 | $15,250 |
Source: Public Records
Map
Nearby Homes
- 515 Cincinnati Ave
- 487 Cincinnati Ave
- 479 Cincinnati Ave
- 525 Cincinnati Ave
- 462 N Miami Ave
- 473 Cincinnati Ave
- 506 Cincinnati Ave
- 486 Cincinnati Ave
- 465 Cincinnati Ave
- 454 N Miami Ave
- 476 Cincinnati Ave
- 495 S Miami Ave
- 451 Cincinnati Ave
- 507 S Miami Ave
- 440 N Miami Ave
- 483 S Miami Ave
- 483 S Miami Ave
- 466 Cincinnati Ave
- 517 S Miami Ave
- 542 Cincinnati Ave
Your Personal Tour Guide
Ask me questions while you tour the home.