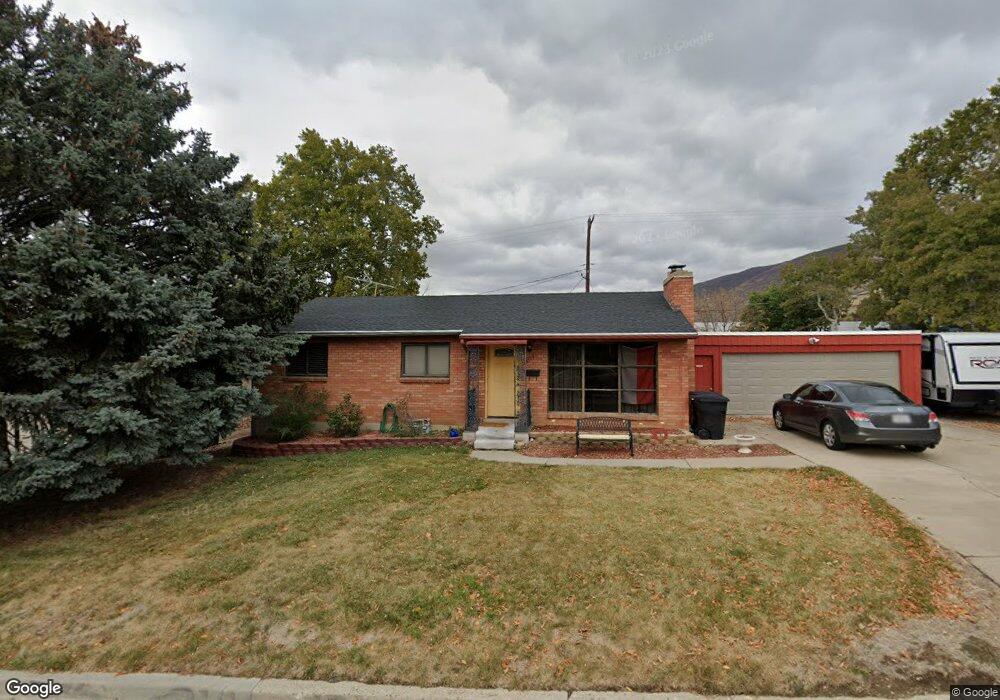
503 E 1050 N Bountiful, UT 84010
Estimated Value: $475,000 - $573,000
3
Beds
2
Baths
1,066
Sq Ft
$492/Sq Ft
Est. Value
About This Home
This home is located at 503 E 1050 N, Bountiful, UT 84010 and is currently estimated at $524,338, approximately $491 per square foot. 503 E 1050 N is a home located in Davis County with nearby schools including Tolman School, Bountiful Junior High School, and Viewmont High School.
Ownership History
Date
Name
Owned For
Owner Type
Purchase Details
Closed on
Dec 5, 2012
Sold by
Whittaker Steven Lee
Bought by
Whittaker Steven Lee and Annesmith Chariti
Current Estimated Value
Purchase Details
Closed on
Apr 11, 2003
Sold by
Whittaker Dorothea H and Whittaker Steven Lee
Bought by
Whittaker Dorothea H
Create a Home Valuation Report for This Property
The Home Valuation Report is an in-depth analysis detailing your home's value as well as a comparison with similar homes in the area
Purchase History
| Date | Buyer | Sale Price | Title Company |
|---|---|---|---|
| Whittaker Steven Lee | -- | None Available | |
| Whittaker Dorothea H | -- | -- |
Source: Public Records
Tax History
| Year | Tax Paid | Tax Assessment Tax Assessment Total Assessment is a certain percentage of the fair market value that is determined by local assessors to be the total taxable value of land and additions on the property. | Land | Improvement |
|---|---|---|---|---|
| 2025 | $2,730 | $248,050 | $117,479 | $130,571 |
| 2024 | $2,556 | $241,450 | $108,552 | $132,898 |
| 2023 | $2,463 | $422,000 | $193,741 | $228,259 |
| 2022 | $2,593 | $244,200 | $102,740 | $141,460 |
| 2021 | $0 | $317,000 | $152,441 | $164,559 |
| 2020 | $1,950 | $280,000 | $138,874 | $141,126 |
| 2019 | $1,967 | $276,000 | $143,741 | $132,259 |
| 2018 | $1,840 | $254,000 | $132,563 | $121,437 |
| 2016 | $1,507 | $112,145 | $39,258 | $72,887 |
| 2015 | $1,486 | $104,445 | $39,258 | $65,187 |
| 2014 | $878 | $106,971 | $39,258 | $67,713 |
| 2013 | -- | $87,283 | $41,880 | $45,403 |
Source: Public Records
Map
Nearby Homes
- 214 E 1250 N
- 978 N 170 E
- 513 N 400 E Unit 14B
- 453 N 400 E Unit 7-D
- 1420 N Main St
- 967 S Courtyard Ln
- 17 E 400 N Unit 19B
- 207 E 820 S
- 683 E 100 N
- 908 Northern Hills Dr Unit 3
- 150 E 735 S Unit 23
- 129 N 800 E
- 933 Northern Hills Cir
- 106 W 700 N
- 49 E 200 N Unit 4
- 41 E 200 N Unit 6
- 16 W 780 S
- 1260 N 200 W
- 55 E 200 N Unit 2
- 252 N Main St
Your Personal Tour Guide
Ask me questions while you tour the home.