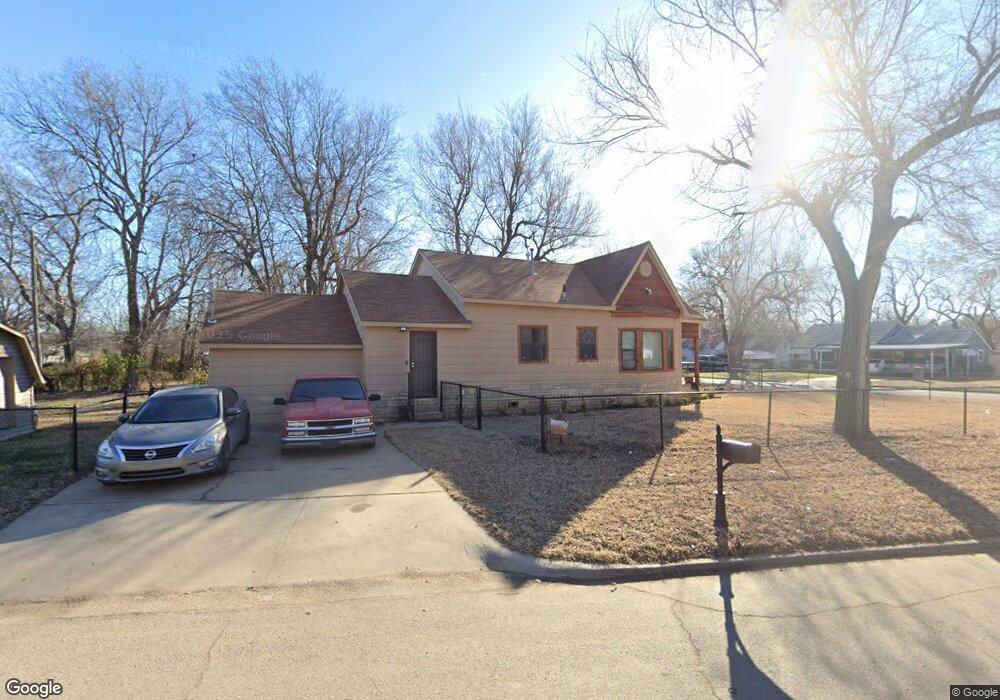
503 E 27th Place N Tulsa, OK 74106
Acre Gardens NeighborhoodEstimated Value: $118,734 - $137,000
3
Beds
1
Bath
1,512
Sq Ft
$87/Sq Ft
Est. Value
About This Home
This home is located at 503 E 27th Place N, Tulsa, OK 74106 and is currently estimated at $132,184, approximately $87 per square foot. 503 E 27th Place N is a home located in Tulsa County with nearby schools including Hawthorne Elementary School, Monroe Demonstration Academy, and McLain High School of Science and Technology.
Ownership History
Date
Name
Owned For
Owner Type
Purchase Details
Closed on
Sep 9, 2024
Sold by
Willis Management Llc
Bought by
Willis Ashlynn
Current Estimated Value
Purchase Details
Closed on
Aug 3, 2023
Sold by
Willis Manuel Lee and Willis Ashlynn Reyee
Bought by
Willis Management Llc
Purchase Details
Closed on
Jun 16, 2022
Sold by
Lee Willis Jr Manuel
Bought by
Willis Ashlynn Renee and Willis Manuel Lee
Purchase Details
Closed on
Jan 4, 2021
Sold by
Moore Stormie
Bought by
Willis Manuel
Purchase Details
Closed on
Feb 19, 2015
Sold by
Shaw Garland Maurice
Bought by
Willis Manuel
Purchase Details
Closed on
Apr 26, 2002
Sold by
Clark Adams Vivian Noreen
Bought by
Shaw Garland
Purchase Details
Closed on
Apr 25, 2002
Sold by
Livingston Clark William Marcus and Livingston Clark Deborah
Bought by
Shaw Garland
Create a Home Valuation Report for This Property
The Home Valuation Report is an in-depth analysis detailing your home's value as well as a comparison with similar homes in the area
Home Values in the Area
Average Home Value in this Area
Purchase History
| Date | Buyer | Sale Price | Title Company |
|---|---|---|---|
| Willis Ashlynn | -- | None Listed On Document | |
| Willis Management Llc | -- | None Listed On Document | |
| Willis Ashlynn Renee | -- | None Listed On Document | |
| Willis Manuel | -- | None Available | |
| Willis Manuel | -- | None Available | |
| Shaw Garland | $17,000 | Tulsa Abstract & Title Co | |
| Shaw Garland | -- | Tulsa Abstract & Title Co | |
| Shaw Garland | -- | Tulsa Abstract & Title Co | |
| Shaw Garland | -- | Tulsa Abstract & Title Co |
Source: Public Records
Tax History
| Year | Tax Paid | Tax Assessment Tax Assessment Total Assessment is a certain percentage of the fair market value that is determined by local assessors to be the total taxable value of land and additions on the property. | Land | Improvement |
|---|---|---|---|---|
| 2025 | $953 | $7,108 | $760 | $6,348 |
| 2024 | $542 | $6,770 | $869 | $5,901 |
| 2023 | $542 | $4,272 | $658 | $3,614 |
| 2022 | $542 | $4,069 | $721 | $3,348 |
| 2021 | $512 | $3,875 | $686 | $3,189 |
| 2020 | $481 | $3,691 | $654 | $3,037 |
| 2019 | $482 | $3,515 | $623 | $2,892 |
| 2018 | $460 | $3,347 | $593 | $2,754 |
| 2017 | $437 | $3,188 | $565 | $2,623 |
| 2016 | $408 | $3,036 | $538 | $2,498 |
| 2015 | $254 | $4,906 | $869 | $4,037 |
| 2014 | $241 | $4,906 | $869 | $4,037 |
Source: Public Records
Map
Nearby Homes
- 314 E Mohawk Blvd
- 321 E Apache St
- 247 E 28th St N
- 231 E Mohawk Blvd
- 261 E 29th St N
- 329 E Zion Place
- 228 E Mohawk Blvd
- 604 E 30th St N
- 707 E Mohawk Blvd
- 2818 N Garrison Place
- 111 E 26th Place N
- 108 E 27th St N
- 2534 N Boston Place
- 327 E Young St
- 303 E Young St
- 2317 N Frankfort Ave
- 2511 N Boston Ave
- 3149 N Hartford Ave
- 2525 N Lansing Ave
- 2432 N Boston Ave
- 507 E 27th Place N
- 502 E 27th Ct N
- 509 E 27th Place N
- 347 E 27th Place N
- 510 E 27th Ct N
- 348 E 27th Ct N
- 508 E 27th Place N
- 504 E 27th Place N
- 514 E 27th Ct N
- 515 E 27th Place N
- 514 E 27th Place N
- 341 E 27th Place N
- 342 E 27th Ct N
- 518 E 27th Place N
- 520 E 27th Ct N
- 348 E 27th Place N
- 337 E 27th Place N
- 531 E 27th Place N
- 524 E 27th Place N
- 336 E 27th Ct N
Your Personal Tour Guide
Ask me questions while you tour the home.