
Seller's Agent in 2013
Bonnie Gross
Coldwell Banker Select
(918) 695-8487
41 in this area
133 Total Sales
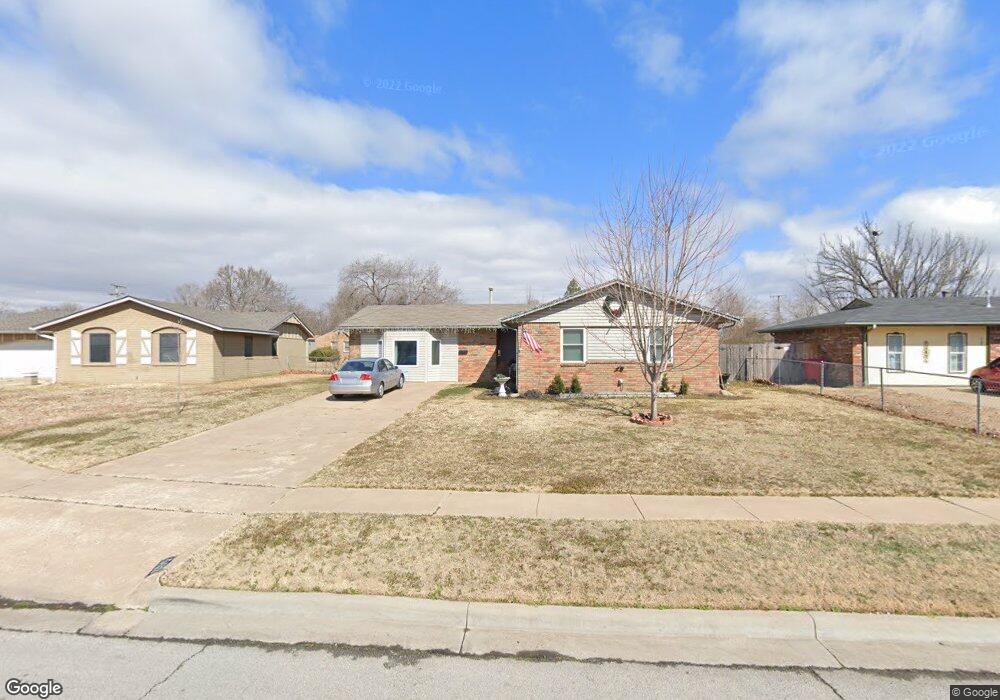
Estimated Value: $186,000 - $222,000
New roof & tile in 2013. Fresh interior paint & remodeled bathroom. Newer vinyl siding & windows,new carpet & linoleum to be installed before closing. 1yr. home warranty, great price for all this space.
Last Agent to Sell the Property
Coldwell Banker Select License #139637 Listed on: 07/17/2013
| Date | Buyer | Sale Price | Title Company |
|---|---|---|---|
| Williams Joshua S | $91,500 | None Available | |
| Brookfield Gobel Relocation Services Llc | $91,500 | None Available | |
| Graham Timothy D | $84,000 | -- | |
| -- | $55,000 | -- |
| Date | Status | Borrower | Loan Amount |
|---|---|---|---|
| Open | Williams Joshua S | $93,367 | |
| Previous Owner | Graham Timothy D | $85,680 |
| Date | Event | Price | List to Sale | Price per Sq Ft |
|---|---|---|---|---|
| 08/29/2013 08/29/13 | Sold | $91,500 | -1.1% | $59 / Sq Ft |
| 07/17/2013 07/17/13 | Pending | -- | -- | -- |
| 07/17/2013 07/17/13 | For Sale | $92,500 | -- | $60 / Sq Ft |
| Year | Tax Paid | Tax Assessment Tax Assessment Total Assessment is a certain percentage of the fair market value that is determined by local assessors to be the total taxable value of land and additions on the property. | Land | Improvement |
|---|---|---|---|---|
| 2025 | $1,534 | $13,614 | $1,510 | $12,104 |
| 2024 | $1,344 | $12,966 | $1,613 | $11,353 |
| 2023 | $1,344 | $12,348 | $1,615 | $10,733 |
| 2022 | $1,337 | $11,760 | $2,684 | $9,076 |
| 2021 | $1,260 | $11,200 | $2,693 | $8,507 |
| 2020 | $1,260 | $11,200 | $2,693 | $8,507 |
| 2019 | $1,255 | $11,200 | $2,693 | $8,507 |
| 2018 | $1,165 | $10,739 | $2,582 | $8,157 |
| 2017 | $1,169 | $10,739 | $2,582 | $8,157 |
| 2016 | $1,155 | $10,568 | $2,541 | $8,027 |
| 2015 | $1,108 | $10,065 | $2,420 | $7,645 |
| 2014 | $1,118 | $10,065 | $2,420 | $7,645 |
Seller's Agent in 2013
Bonnie Gross
Coldwell Banker Select
(918) 695-8487
41 in this area
133 Total Sales
G
Buyer's Agent in 2013
Ginger Jones
Keller Williams Premier
(918) 693-2344
1 Total Sale
Source: MLS Technology
MLS Number: 1323180
APN: 61450-14-30-08190
Disclaimer: Certain information contained herein is derived from information provided by parties other than Homes.com. All information provided is deemed reliable, but is not guaranteed to be accurate and should be independently verified.
![]() IDX information is provided exclusively for personal, non-commercial use, and may not be used for any purpose other than to identify prospective properties consumers may be interested in purchasing.
IDX information is provided exclusively for personal, non-commercial use, and may not be used for any purpose other than to identify prospective properties consumers may be interested in purchasing.
Information is deemed reliable but not guaranteed.
Ask me questions while you tour the home.