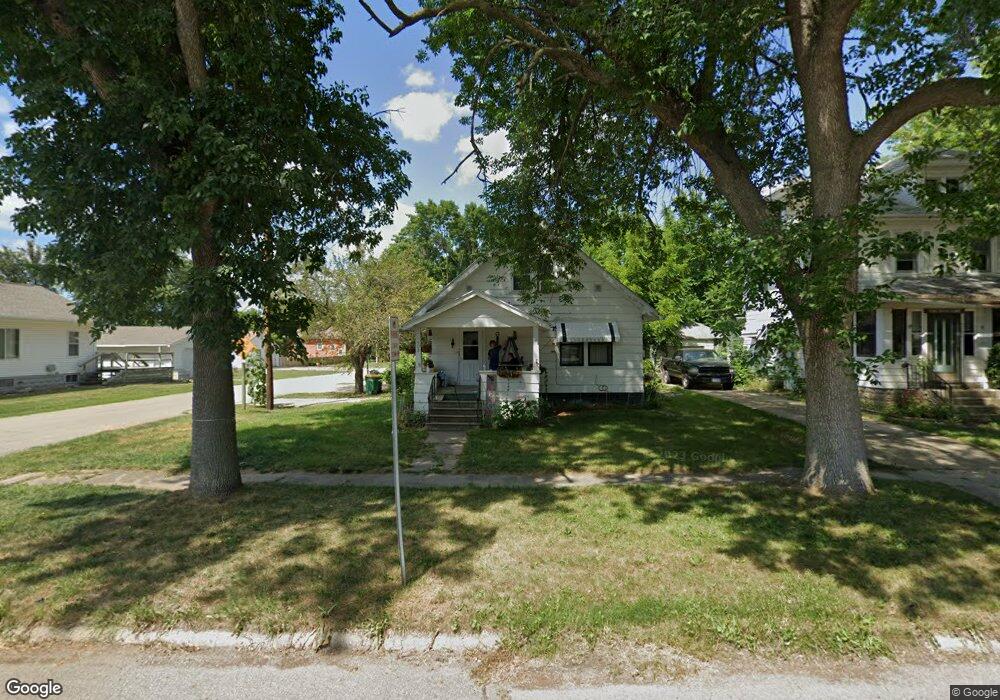
503 E Main St Klemme, IA 50449
Estimated Value: $51,803 - $82,000
2
Beds
1
Bath
975
Sq Ft
$67/Sq Ft
Est. Value
About This Home
This home is located at 503 E Main St, Klemme, IA 50449 and is currently estimated at $65,201, approximately $66 per square foot. 503 E Main St is a home located in Hancock County with nearby schools including Richard O. Jacobson Elementary School and Belmond-Klemme Community Junior/Senior High School.
Ownership History
Date
Name
Owned For
Owner Type
Purchase Details
Closed on
Jun 26, 2019
Sold by
Greimann Coleen M
Bought by
Watson John S and Watson Katherine E
Current Estimated Value
Home Financials for this Owner
Home Financials are based on the most recent Mortgage that was taken out on this home.
Original Mortgage
$29,950
Outstanding Balance
$26,117
Interest Rate
3.7%
Mortgage Type
New Conventional
Estimated Equity
$39,084
Purchase Details
Closed on
Dec 28, 2004
Sold by
Aguilar Ana Griselda and Aguilar Sergio
Bought by
Greimann Coleen M
Create a Home Valuation Report for This Property
The Home Valuation Report is an in-depth analysis detailing your home's value as well as a comparison with similar homes in the area
Purchase History
We collect this data history from publicly available records. To have your information removed, we recommend requesting removal directly through your county’s website.
| Date | Buyer | Sale Price | Title Company |
|---|---|---|---|
| Watson John S | $30,000 | -- | |
| Greimann Coleen M | $19,500 | None Available |
Source: Public Records
Mortgage History
We collect this data history from publicly available records. To have your information removed, we recommend requesting removal directly through your county’s website.
| Date | Status | Borrower | Loan Amount |
|---|---|---|---|
| Open | Watson John S | $29,950 |
Source: Public Records
Tax History
| Year | Tax Paid | Tax Assessment Tax Assessment Total Assessment is a certain percentage of the fair market value that is determined by local assessors to be the total taxable value of land and additions on the property. | Land | Improvement |
|---|---|---|---|---|
| 2025 | $1,062 | $26,670 | $6,380 | $20,290 |
| 2024 | $1,062 | $21,980 | $4,080 | $17,900 |
| 2023 | $324 | $20,920 | $4,080 | $16,840 |
| 2022 | $1,050 | $21,560 | $4,080 | $17,480 |
| 2021 | $700 | $19,430 | $4,080 | $15,350 |
| 2020 | $707 | $18,180 | $4,080 | $14,100 |
| 2019 | $318 | $18,180 | $4,080 | $14,100 |
| 2018 | $538 | $17,230 | $4,080 | $13,150 |
| 2017 | $651 | $22,890 | $0 | $0 |
| 2016 | $469 | $22,890 | $0 | $0 |
| 2015 | $412 | $23,850 | $0 | $0 |
| 2014 | $424 | $23,850 | $0 | $0 |
Source: Public Records
Map
Nearby Homes
Your Personal Tour Guide
Ask me questions while you tour the home.