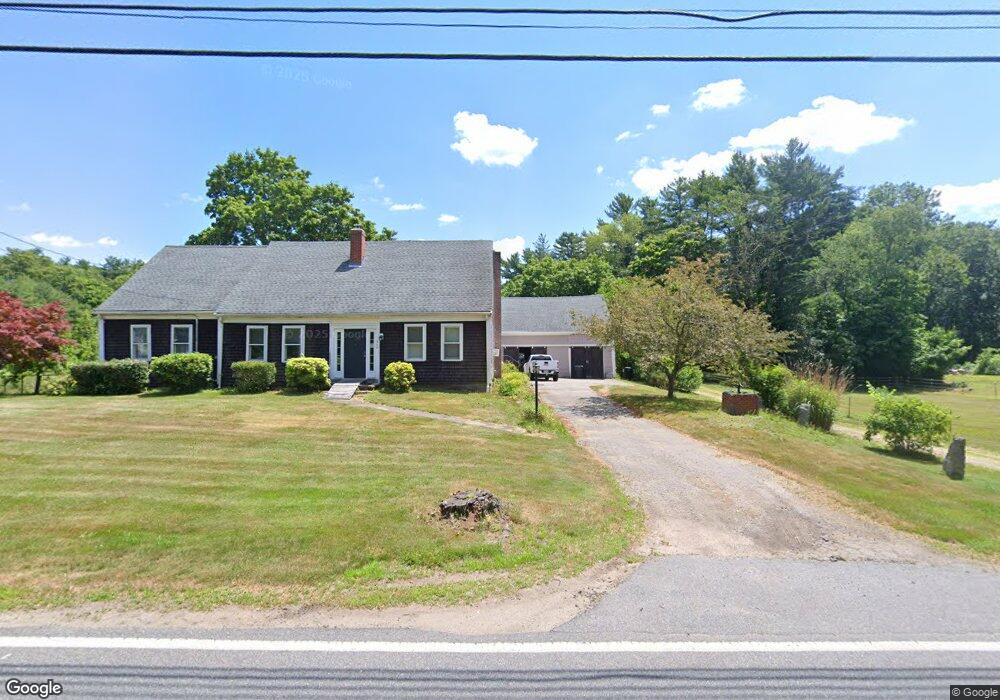
503 Elm St Hanson, MA 02341
Estimated Value: $616,000 - $732,000
4
Beds
2
Baths
2,405
Sq Ft
$278/Sq Ft
Est. Value
About This Home
This home is located at 503 Elm St, Hanson, MA 02341 and is currently estimated at $668,709, approximately $278 per square foot. 503 Elm St is a home located in Plymouth County.
Ownership History
Date
Name
Owned For
Owner Type
Purchase Details
Closed on
Jun 7, 2017
Sold by
Mcgrath Scott J
Bought by
Mcgrath Rt
Current Estimated Value
Purchase Details
Closed on
Sep 15, 2006
Sold by
Obrien Joseph M and Obrien Sabrina M
Bought by
Mcgrath Robert W and Mcgrath Myrtle E
Home Financials for this Owner
Home Financials are based on the most recent Mortgage that was taken out on this home.
Original Mortgage
$328,000
Interest Rate
6.71%
Mortgage Type
Purchase Money Mortgage
Purchase Details
Closed on
Sep 29, 1987
Sold by
Cram Tr Edith E
Bought by
Obrien Joseph M
Create a Home Valuation Report for This Property
The Home Valuation Report is an in-depth analysis detailing your home's value as well as a comparison with similar homes in the area
Home Values in the Area
Average Home Value in this Area
Purchase History
| Date | Buyer | Sale Price | Title Company |
|---|---|---|---|
| Mcgrath Rt | -- | -- | |
| Mcgrath Scott J | -- | -- | |
| Mcgrath Robert W | $410,000 | -- | |
| Obrien Joseph M | $98,500 | -- |
Source: Public Records
Mortgage History
| Date | Status | Borrower | Loan Amount |
|---|---|---|---|
| Previous Owner | Obrien Joseph M | $98,790 | |
| Previous Owner | Obrien Joseph M | $101,000 | |
| Previous Owner | Obrien Joseph M | $328,000 | |
| Previous Owner | Obrien Joseph M | $41,968 |
Source: Public Records
Tax History
| Year | Tax Paid | Tax Assessment Tax Assessment Total Assessment is a certain percentage of the fair market value that is determined by local assessors to be the total taxable value of land and additions on the property. | Land | Improvement |
|---|---|---|---|---|
| 2025 | $6,392 | $477,700 | $187,100 | $290,600 |
| 2024 | $5,529 | $413,200 | $181,700 | $231,500 |
| 2023 | $5,663 | $399,400 | $181,700 | $217,700 |
| 2022 | $5,636 | $373,500 | $165,200 | $208,300 |
| 2021 | $5,365 | $355,300 | $158,900 | $196,400 |
| 2020 | $5,392 | $353,100 | $153,500 | $199,600 |
| 2019 | $5,272 | $339,500 | $150,600 | $188,900 |
| 2018 | $5,248 | $331,500 | $144,800 | $186,700 |
| 2017 | $5,130 | $321,000 | $137,900 | $183,100 |
| 2016 | $5,240 | $316,600 | $137,900 | $178,700 |
| 2015 | $5,010 | $314,700 | $137,900 | $176,800 |
Source: Public Records
Map
Nearby Homes
- 170 Elm St
- 1 John Wade Dr
- 1139 Main St Unit 4
- 1054 Main St
- 72 Phillips St
- 80 Phillips St
- 148 Lot 1a Elm St
- 1247 Central St
- 17 Fieldcrest Dr
- 1754 Central St
- 26 Franklin St
- 780 Old Plymouth St
- 102 Leon Ct
- 126-130 Franklin St
- 29 Douglas Dr
- 1397 Plymouth St Unit 1397
- 318 South St
- 29 Ocean Ave
- 34 Rolling Hills Dr
- 115 Waltham St