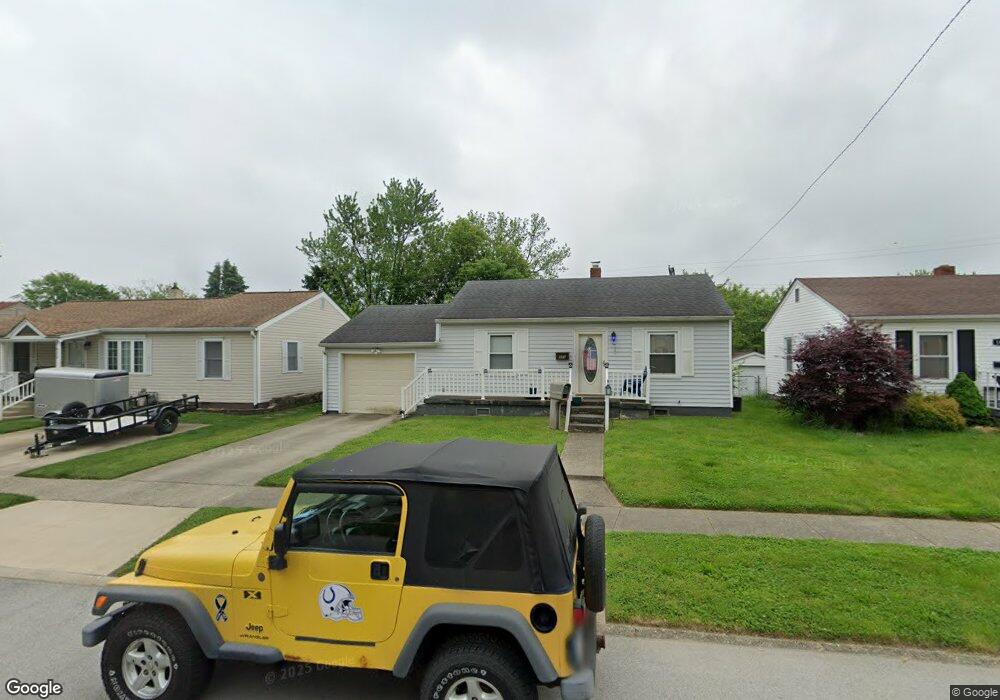
503 Fletcher Ln Beech Grove, IN 46107
Estimated Value: $137,000 - $170,000
2
Beds
1
Bath
720
Sq Ft
$218/Sq Ft
Est. Value
About This Home
This home is located at 503 Fletcher Ln, Beech Grove, IN 46107 and is currently estimated at $157,283, approximately $218 per square foot. 503 Fletcher Ln is a home located in Marion County with nearby schools including Hornet Park Elementary School, South Grove Intermediate School, and Central Elementary School.
Ownership History
Date
Name
Owned For
Owner Type
Purchase Details
Closed on
Mar 8, 2023
Sold by
Crabtree Ernest L
Bought by
Crabtree Ernest L and Crabtree Sherri L
Current Estimated Value
Purchase Details
Closed on
Mar 16, 2012
Sold by
Federal Home Loan Mortgage Corporation
Bought by
Crabtree Ernest L
Purchase Details
Closed on
Mar 21, 2011
Sold by
Siggers Kenneth
Bought by
Federal Home Loan Mortgage Corp
Create a Home Valuation Report for This Property
The Home Valuation Report is an in-depth analysis detailing your home's value as well as a comparison with similar homes in the area
Home Values in the Area
Average Home Value in this Area
Purchase History
| Date | Buyer | Sale Price | Title Company |
|---|---|---|---|
| Crabtree Ernest L | -- | -- | |
| Crabtree Ernest L | $33,250 | Total Title | |
| Federal Home Loan Mortgage Corp | $31,117 | None Available |
Source: Public Records
Tax History Compared to Growth
Tax History
| Year | Tax Paid | Tax Assessment Tax Assessment Total Assessment is a certain percentage of the fair market value that is determined by local assessors to be the total taxable value of land and additions on the property. | Land | Improvement |
|---|---|---|---|---|
| 2024 | $2,292 | $91,500 | $14,000 | $77,500 |
| 2023 | $2,292 | $82,100 | $14,000 | $68,100 |
| 2022 | $2,107 | $73,600 | $14,000 | $59,600 |
| 2021 | $1,987 | $71,700 | $14,000 | $57,700 |
| 2020 | $864 | $74,300 | $14,000 | $60,300 |
| 2019 | $846 | $74,300 | $11,600 | $62,700 |
| 2018 | $708 | $63,400 | $11,600 | $51,800 |
| 2017 | $666 | $58,500 | $11,600 | $46,900 |
| 2016 | $1,473 | $59,400 | $11,600 | $47,800 |
| 2014 | $1,377 | $58,500 | $11,600 | $46,900 |
| 2013 | $632 | $58,500 | $11,600 | $46,900 |
Source: Public Records
Map
Nearby Homes