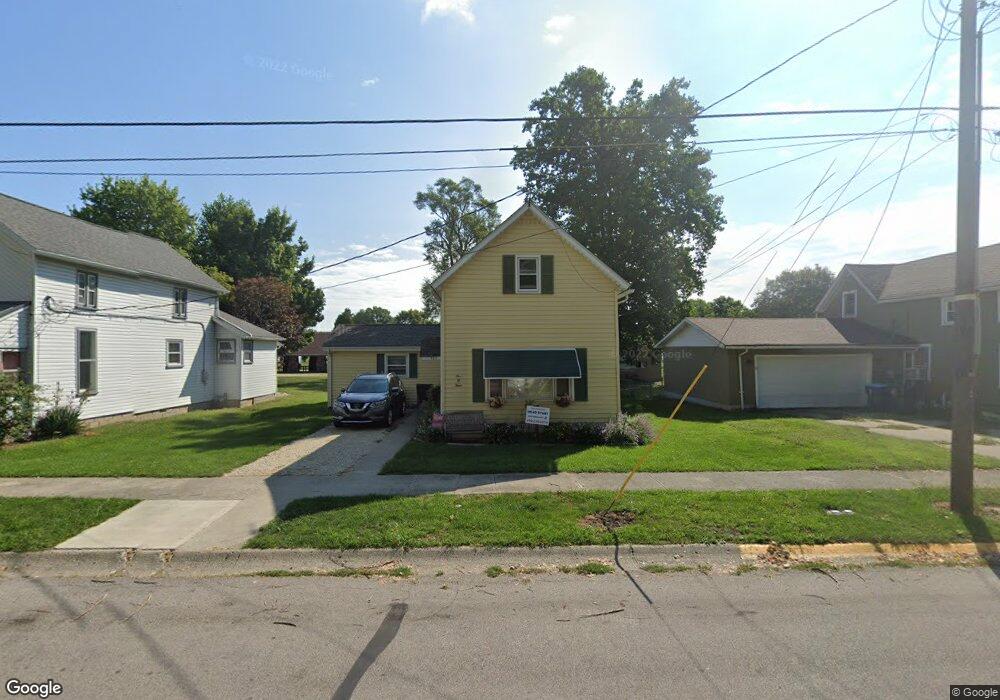
503 Grayston Ave Huntington, IN 46750
Estimated Value: $68,000 - $110,000
3
Beds
1
Bath
1,520
Sq Ft
$61/Sq Ft
Est. Value
About This Home
This home is located at 503 Grayston Ave, Huntington, IN 46750 and is currently estimated at $92,943, approximately $61 per square foot. 503 Grayston Ave is a home located in Huntington County with nearby schools including Lincoln Elementary School, Crestview Middle School, and Huntington North High School.
Ownership History
Date
Name
Owned For
Owner Type
Purchase Details
Closed on
Apr 18, 2023
Sold by
Bealer Jessaleen M
Bought by
Williams Rei Llc
Current Estimated Value
Purchase Details
Closed on
Oct 22, 2012
Sold by
Bealer Jessaleen M
Bought by
Wall Jason Alan and Wall Jennifer Dawn
Purchase Details
Closed on
Apr 27, 2007
Sold by
Fannie Mae
Bought by
Bealer Jessaleen M
Home Financials for this Owner
Home Financials are based on the most recent Mortgage that was taken out on this home.
Original Mortgage
$40,000
Interest Rate
6.2%
Mortgage Type
New Conventional
Purchase Details
Closed on
Feb 16, 2007
Sold by
Gmac Mortgage Corp
Bought by
Federal National Mortgage Association
Purchase Details
Closed on
Feb 15, 2007
Sold by
Burns Jeremiah R and Burns Jeremiah
Bought by
Gmac Mortgage Corp
Create a Home Valuation Report for This Property
The Home Valuation Report is an in-depth analysis detailing your home's value as well as a comparison with similar homes in the area
Home Values in the Area
Average Home Value in this Area
Purchase History
| Date | Buyer | Sale Price | Title Company |
|---|---|---|---|
| Williams Rei Llc | $60,000 | None Listed On Document | |
| Wall Jason Alan | -- | None Available | |
| Bealer Jessaleen M | -- | None Available | |
| Federal National Mortgage Association | -- | None Available | |
| Gmac Mortgage Corp | $60,209 | None Available |
Source: Public Records
Mortgage History
| Date | Status | Borrower | Loan Amount |
|---|---|---|---|
| Previous Owner | Bealer Jessaleen M | $40,000 |
Source: Public Records
Tax History Compared to Growth
Tax History
| Year | Tax Paid | Tax Assessment Tax Assessment Total Assessment is a certain percentage of the fair market value that is determined by local assessors to be the total taxable value of land and additions on the property. | Land | Improvement |
|---|---|---|---|---|
| 2024 | $1,436 | $71,800 | $8,400 | $63,400 |
| 2023 | -- | $71,800 | $8,400 | $63,400 |
| 2022 | $0 | $64,100 | $8,400 | $55,700 |
| 2021 | $0 | $55,600 | $6,600 | $49,000 |
| 2020 | $0 | $50,300 | $6,600 | $43,700 |
| 2019 | $0 | $43,800 | $6,600 | $37,200 |
| 2018 | $0 | $43,800 | $6,600 | $37,200 |
| 2017 | $0 | $43,400 | $6,600 | $36,800 |
| 2016 | $860 | $43,000 | $6,600 | $36,400 |
| 2014 | $282 | $42,600 | $6,600 | $36,000 |
| 2013 | $282 | $43,400 | $6,600 | $36,800 |
Source: Public Records
Map
Nearby Homes
- 475 Grayston Ave
- 453 Grayston Ave
- 500 Grayston Ave
- 478 Grayston Ave
- 470 Grayston Ave
- 439 Grayston Ave
- 452 Grayston Ave
- 431 Grayston Ave
- 442 Grayston Ave
- 473 Swan St
- 463 Swan St
- 525 Swan St
- 417 Grayston Ave
- 453 Swan St
- 539 Swan St
- 418 Grayston Ave
- 441 Swan St
- 403 Grayston Ave
- 615 Grayston Ave
- 618 Grayston Ave