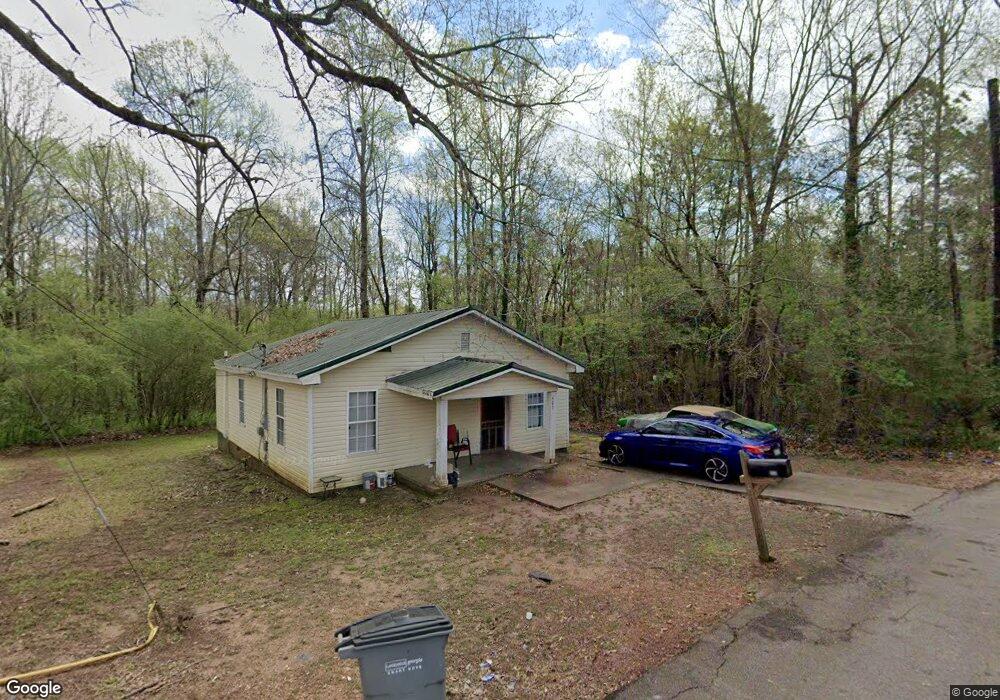
503 Guinn St Lagrange, GA 30241
Estimated Value: $62,774 - $134,000
2
Beds
2
Baths
959
Sq Ft
$92/Sq Ft
Est. Value
About This Home
This home is located at 503 Guinn St, Lagrange, GA 30241 and is currently estimated at $88,694, approximately $92 per square foot. 503 Guinn St is a home located in Troup County with nearby schools including Whitesville Road Elementary School, Berta Weathersbee Elementary School, and Rosemont Elementary School.
Ownership History
Date
Name
Owned For
Owner Type
Purchase Details
Closed on
Aug 3, 2022
Sold by
Smith Rodney
Bought by
Martinez Antonio
Current Estimated Value
Purchase Details
Closed on
Nov 29, 2017
Sold by
Ford Minnie Myrtle
Bought by
Smith Rodney
Purchase Details
Closed on
May 17, 2013
Sold by
Carden Robert
Bought by
Ford Charlie
Purchase Details
Closed on
Mar 24, 2009
Sold by
Gates Ronnie
Bought by
Carden Robert
Purchase Details
Closed on
Sep 13, 2004
Sold by
Shirley O Gates
Bought by
Gates Ronnie
Purchase Details
Closed on
Jun 1, 2004
Sold by
Ronnie Gates
Bought by
Shirley O Gates
Purchase Details
Closed on
Aug 11, 2003
Sold by
Madeline Moore Tucker
Bought by
Ronnie Gates
Purchase Details
Closed on
Jul 1, 1994
Sold by
Bobby Ray Morrow
Bought by
Madeline Moore Tucker
Purchase Details
Closed on
Jun 29, 1984
Bought by
Bobby Ray Morrow
Purchase Details
Closed on
Jan 7, 1977
Create a Home Valuation Report for This Property
The Home Valuation Report is an in-depth analysis detailing your home's value as well as a comparison with similar homes in the area
Purchase History
| Date | Buyer | Sale Price | Title Company |
|---|---|---|---|
| Martinez Antonio | $45,000 | -- | |
| Smith Rodney | $17,500 | -- | |
| Ford Charlie | $14,000 | -- | |
| Carden Robert | $16,000 | -- | |
| Carden Robert | $16,000 | -- | |
| Gates Ronnie | -- | -- | |
| Shirley O Gates | -- | -- | |
| Ronnie Gates | $85,000 | -- | |
| Madeline Moore Tucker | $20,000 | -- | |
| Bobby Ray Morrow | $36,000 | -- | |
| -- | -- | -- |
Source: Public Records
Tax History
| Year | Tax Paid | Tax Assessment Tax Assessment Total Assessment is a certain percentage of the fair market value that is determined by local assessors to be the total taxable value of land and additions on the property. | Land | Improvement |
|---|---|---|---|---|
| 2025 | $638 | $23,400 | $4,480 | $18,920 |
| 2024 | $585 | $21,440 | $4,480 | $16,960 |
| 2023 | $491 | $21,080 | $4,480 | $16,600 |
| 2022 | $447 | $16,000 | $3,480 | $12,520 |
| 2021 | $445 | $14,760 | $2,440 | $12,320 |
| 2020 | $445 | $14,760 | $2,440 | $12,320 |
| 2019 | $419 | $13,900 | $2,940 | $10,960 |
| 2018 | $211 | $13,900 | $2,940 | $10,960 |
| 2017 | $419 | $13,900 | $2,940 | $10,960 |
| 2016 | $408 | $13,542 | $2,940 | $10,602 |
| 2015 | $394 | $13,052 | $2,450 | $10,602 |
| 2014 | $169 | $5,600 | $996 | $4,604 |
| 2013 | -- | $13,870 | $2,468 | $11,402 |
Source: Public Records
Map
Nearby Homes
- 0 Lanett Ave
- 213 Euclid Ave
- 216 Euclid Ave
- 1315 Hamilton Rd
- 1216 Hamilton Rd
- 137 Edgewood Ave
- LOT 15 Edgewood Ave
- 130 Edgewood Ave
- LOT 33 E Hillside Dr
- LOT 34 E Hillside Dr
- 1404 Hamilton Rd
- 1404-1406 Hamilton
- 319 Cooley Rd
- 924 New Mexico St
- 304 Butler St
- 901 Whiteline St
- 439 Cooley Rd
- 0 Boggs St Unit 10550243
- 0 Boggs St Unit 10550231
- 0 Boggs St Unit 10550239
Your Personal Tour Guide
Ask me questions while you tour the home.