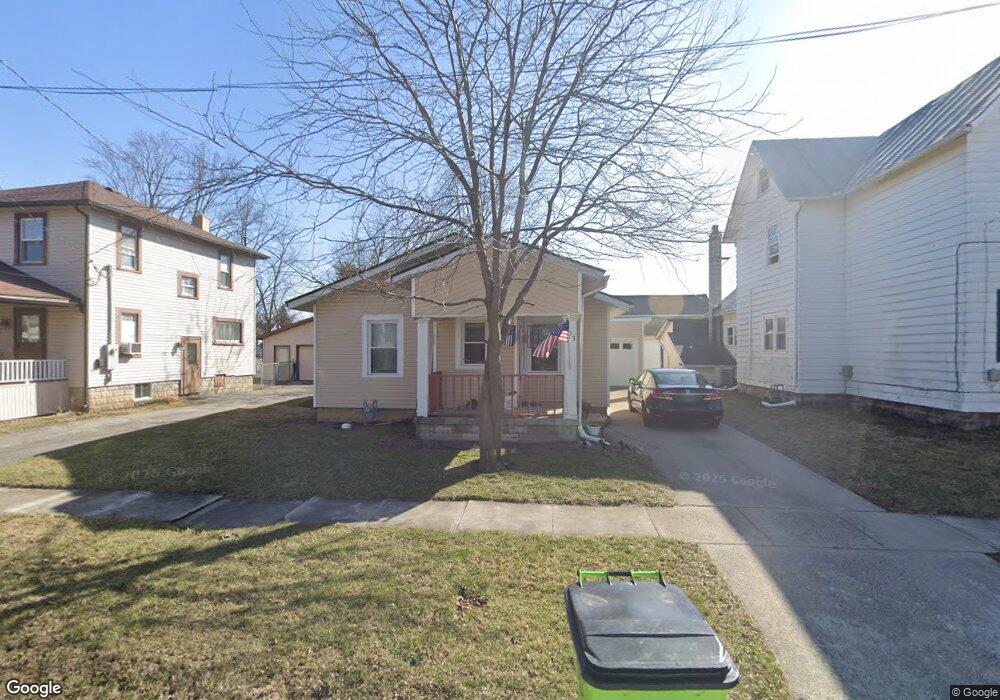
503 H St Findlay, OH 45840
Estimated Value: $134,918 - $177,000
About This Home
This home is located at 503 H St, Findlay, OH 45840 and is currently estimated at $153,730, approximately $158 per square foot. 503 H St is a home located in Hancock County with nearby schools including Whittier Primary School, Bigelow Hill Elementary School, and Glenwood Middle School.
Ownership History
We collect this data history from publicly available records. To have your information removed, we recommend requesting removal directly through your county’s website.
Purchase Details
Purchase Details
Purchase Details
Purchase Details
Home Financials for this Owner
Home Financials are based on the most recent Mortgage that was taken out on this home.Home Values in the Area
Average Home Value in this Area
Purchase History
We collect this data history from publicly available records. To have your information removed, we recommend requesting removal directly through your county’s website.
| Date | Buyer | Sale Price | Title Company |
|---|---|---|---|
| $23,550 | Lakeside Title | ||
| $34,667 | None Available | ||
| -- | None Available | ||
| $74,300 | Whitman Title |
Mortgage History
We collect this data history from publicly available records. To have your information removed, we recommend requesting removal directly through your county’s website.
| Date | Status | Borrower | Loan Amount |
|---|---|---|---|
| Previous Owner | $73,069 |
Tax History
We collect this data history from publicly available records. To have your information removed, we recommend requesting removal directly through your county’s website.
| Year | Tax Paid | Tax Assessment Tax Assessment Total Assessment is a certain percentage of the fair market value that is determined by local assessors to be the total taxable value of land and additions on the property. | Land | Improvement |
|---|---|---|---|---|
| 2025 | $1,593 | $50,620 | $4,130 | $46,490 |
| 2024 | $1,282 | $35,170 | $2,870 | $32,300 |
| 2023 | $1,284 | $35,170 | $2,870 | $32,300 |
| 2022 | $1,280 | $35,170 | $2,870 | $32,300 |
| 2021 | $886 | $21,200 | $3,370 | $17,830 |
| 2020 | $885 | $21,200 | $3,370 | $17,830 |
| 2019 | $868 | $21,200 | $3,370 | $17,830 |
| 2018 | $823 | $18,440 | $2,930 | $15,510 |
| 2017 | $823 | $18,440 | $2,930 | $15,510 |
| 2016 | $824 | $18,440 | $2,930 | $15,510 |
| 2015 | $1,002 | $22,290 | $2,930 | $19,360 |
| 2014 | $1,003 | $22,290 | $2,930 | $19,360 |
| 2012 | $901 | $19,870 | $2,930 | $16,940 |
Map
- 617 Lynn St
- 517 Center St
- 640 Center St
- 755 Dayton Ave
- 439 Carnahan Ave
- 317 Garfield Ave
- 308 Garfield Ave
- 304 Garfield Ave
- 322 Midland Ave
- 310 Osborn Ave
- 206 Midland Ave
- 301 Howard St
- 700 Woodworth Dr
- 1104 Countryside Dr Unit D7
- 122 Allen Ave
- 1062 Vincent St
- 100 Warrington Ave
- 923 Harmon St
- 1134 Brenda Ct
- 309 Huron Rd
Ask me questions while you tour the home.