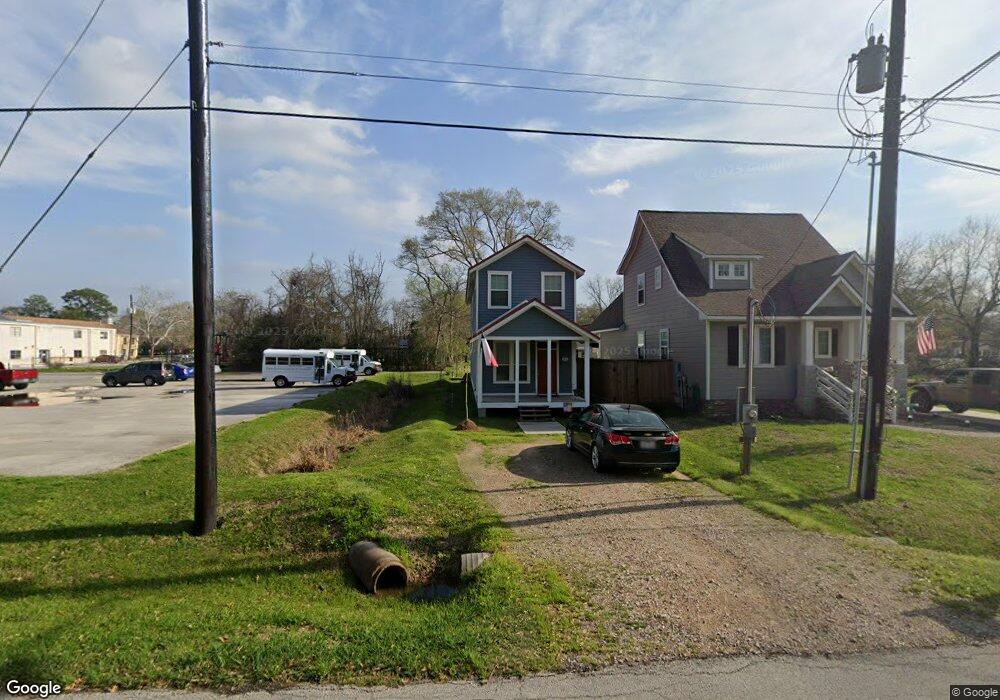
503 Hicks St Tomball, TX 77375
Estimated Value: $265,172 - $360,000
3
Beds
2
Baths
1,620
Sq Ft
$200/Sq Ft
Est. Value
About This Home
This home is located at 503 Hicks St, Tomball, TX 77375 and is currently estimated at $323,793, approximately $199 per square foot. 503 Hicks St is a home with nearby schools including Tomball Elementary School, Tomball Intermediate School, and Tomball Junior High School.
Ownership History
Date
Name
Owned For
Owner Type
Purchase Details
Closed on
May 8, 2020
Sold by
Bennett Michael
Bought by
Phuksahome Joanie and Phuksahome Tommy
Current Estimated Value
Purchase Details
Closed on
Jul 3, 2013
Sold by
City Of Tomball
Bought by
Mccall Christopher G and Mccall Cathy
Purchase Details
Closed on
Apr 11, 2002
Sold by
Campbell Isbell Cranford
Bought by
City Of Tomball and Tomball Independent School District
Purchase Details
Closed on
May 12, 1999
Sold by
Sueba Investments #22 Ltd
Bought by
D R Horton Texas Ltd
Create a Home Valuation Report for This Property
The Home Valuation Report is an in-depth analysis detailing your home's value as well as a comparison with similar homes in the area
Home Values in the Area
Average Home Value in this Area
Purchase History
| Date | Buyer | Sale Price | Title Company |
|---|---|---|---|
| Phuksahome Joanie | -- | Alamo Title Company | |
| Mccall Christopher G | -- | None Available | |
| City Of Tomball | -- | -- | |
| D R Horton Texas Ltd | -- | -- |
Source: Public Records
Tax History
| Year | Tax Paid | Tax Assessment Tax Assessment Total Assessment is a certain percentage of the fair market value that is determined by local assessors to be the total taxable value of land and additions on the property. | Land | Improvement |
|---|---|---|---|---|
| 2025 | $3,462 | $233,727 | $51,188 | $182,539 |
| 2024 | $3,462 | $261,938 | $47,775 | $214,163 |
| 2023 | $2,836 | $259,820 | $40,950 | $218,870 |
| 2022 | $4,047 | $219,627 | $30,713 | $188,914 |
| 2021 | $3,871 | $163,228 | $22,181 | $141,047 |
| 2020 | $3,830 | $156,172 | $17,063 | $139,109 |
| 2019 | $2,985 | $118,327 | $13,650 | $104,677 |
| 2018 | $1,514 | $112,990 | $6,825 | $106,165 |
| 2017 | $1,807 | $71,723 | $6,825 | $64,898 |
| 2016 | $344 | $13,650 | $13,650 | $0 |
| 2015 | $347 | $13,650 | $13,650 | $0 |
| 2014 | $347 | $13,650 | $13,650 | $0 |
Source: Public Records
Map
Nearby Homes
- 302 Epps St
- 18818 Cornelia Fields Ln
- 18723 Buttercup Farms Ln
- 2235 Cold Stream Ln
- 19935 Epona Creek Dr
- 18707 Buttercup Farms Ln
- 18826 Cornelia Fields Ln
- 200 S Cherry St
- 701 Malone St
- 508 Clarence St
- 712 Clarence St
- 504 Percival St Unit A
- 0 N Sycamore St
- 614 Percival St
- 410 N Peach St
- 204 Vernon St
- TBD Clayton St
- 702 Clayton St
- 200 S Vernon St
- 221 Carrell St
Your Personal Tour Guide
Ask me questions while you tour the home.