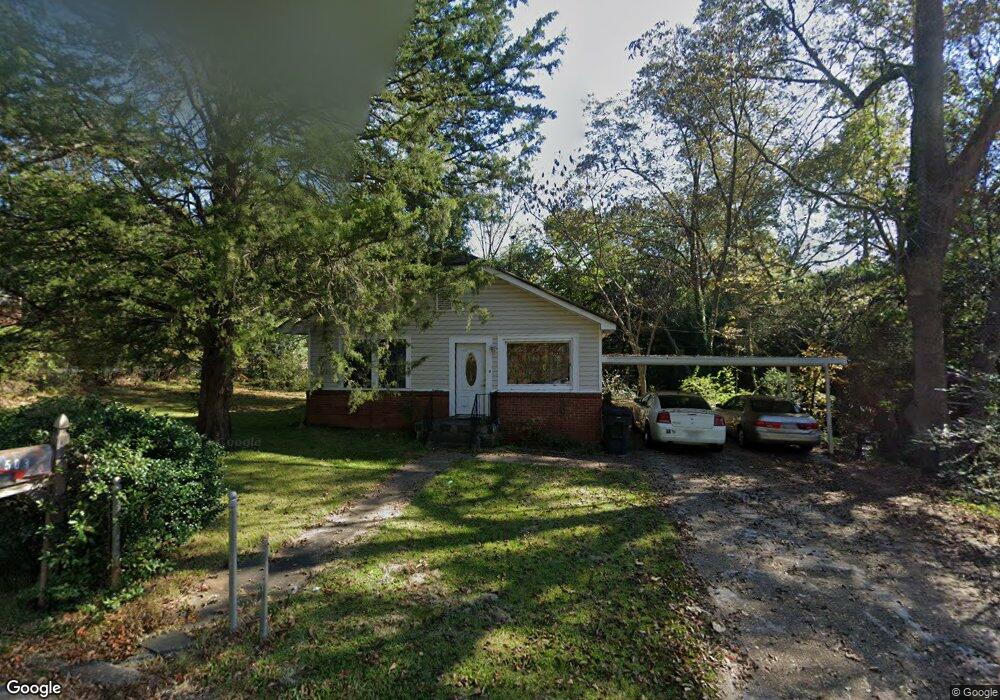
503 Jenkins St Lagrange, GA 30240
Estimated Value: $86,152 - $112,000
3
Beds
1
Bath
1,064
Sq Ft
$95/Sq Ft
Est. Value
About This Home
This home is located at 503 Jenkins St, Lagrange, GA 30240 and is currently estimated at $101,288, approximately $95 per square foot. 503 Jenkins St is a home located in Troup County with nearby schools including Ethel W. Kight Elementary School, Hollis Hand Elementary School, and Franklin Forest Elementary School.
Ownership History
Date
Name
Owned For
Owner Type
Purchase Details
Closed on
Jun 28, 2007
Sold by
Burnett Milton
Bought by
Marshall Scott Thomas
Current Estimated Value
Home Financials for this Owner
Home Financials are based on the most recent Mortgage that was taken out on this home.
Original Mortgage
$45,000
Outstanding Balance
$27,935
Interest Rate
6.37%
Mortgage Type
New Conventional
Estimated Equity
$73,353
Purchase Details
Closed on
May 15, 2006
Sold by
Hayes Juanita
Bought by
Burnett Milton
Purchase Details
Closed on
Dec 20, 2005
Sold by
Hamlin Angelia R
Bought by
Hayes Juanita
Purchase Details
Closed on
Sep 7, 2001
Sold by
Madge Evans
Bought by
Angela Hamlin
Purchase Details
Closed on
Dec 6, 1977
Sold by
Evans Dessie
Bought by
Madge Evans
Purchase Details
Closed on
Jan 1, 1971
Sold by
Overby Marjorie Bradley
Bought by
Evans Dessie
Purchase Details
Closed on
Jul 1, 1948
Bought by
Overby Marjorie Bradley
Create a Home Valuation Report for This Property
The Home Valuation Report is an in-depth analysis detailing your home's value as well as a comparison with similar homes in the area
Home Values in the Area
Average Home Value in this Area
Purchase History
| Date | Buyer | Sale Price | Title Company |
|---|---|---|---|
| Marshall Scott Thomas | $50,000 | -- | |
| Burnett Milton | $20,000 | -- | |
| Hayes Juanita | $55,000 | -- | |
| Angela Hamlin | -- | -- | |
| Madge Evans | -- | -- | |
| Evans Dessie | $12,100 | -- | |
| Overby Marjorie Bradley | -- | -- |
Source: Public Records
Mortgage History
| Date | Status | Borrower | Loan Amount |
|---|---|---|---|
| Open | Marshall Scott Thomas | $45,000 |
Source: Public Records
Tax History Compared to Growth
Tax History
| Year | Tax Paid | Tax Assessment Tax Assessment Total Assessment is a certain percentage of the fair market value that is determined by local assessors to be the total taxable value of land and additions on the property. | Land | Improvement |
|---|---|---|---|---|
| 2024 | $768 | $28,160 | $5,040 | $23,120 |
| 2023 | $715 | $26,200 | $5,040 | $21,160 |
| 2022 | $682 | $24,440 | $5,040 | $19,400 |
| 2021 | $648 | $21,480 | $5,040 | $16,440 |
| 2020 | $648 | $21,480 | $5,040 | $16,440 |
| 2019 | $602 | $19,960 | $5,040 | $14,920 |
| 2018 | $614 | $20,360 | $5,440 | $14,920 |
| 2017 | $614 | $20,360 | $5,440 | $14,920 |
| 2016 | $599 | $19,859 | $5,440 | $14,419 |
| 2015 | $589 | $19,496 | $5,077 | $14,419 |
| 2014 | $567 | $18,737 | $5,077 | $13,660 |
| 2013 | -- | $20,448 | $5,060 | $15,388 |
Source: Public Records
Map
Nearby Homes
- 107 Clark St
- 211 Moores Hill
- 0 Moores Hill
- 608 Wilburn Ave
- 610 Wilburn Ave
- 202 Parker Ln
- 102 Parker St
- 507 S Lee St
- 109 Garfield St
- 802 Monroe St
- 612 S Lee St
- 0 N Lee St Unit 10550825
- 102 Crown St Unit LOT 1
- 209 N Lee St
- 101 Crown St Unit LOT 5
- The Rhodes Plan at Crown Street Cottages
- The Truitt Plan at Crown Street Cottages
- The Callaway Plan at Crown Street Cottages
- 701 Jefferson St
- 217 Jefferson St