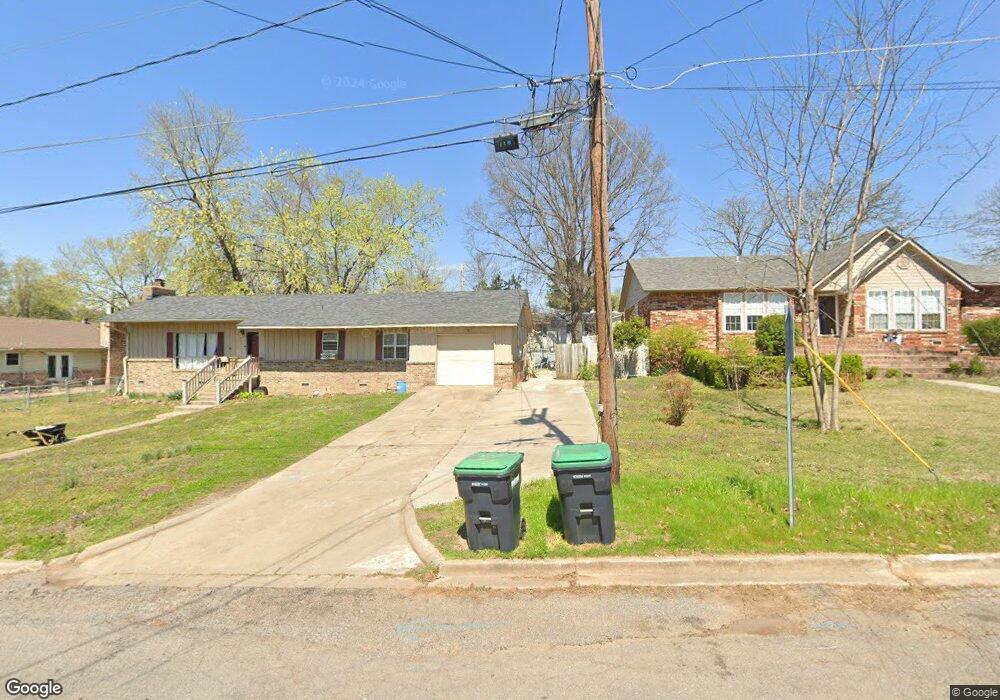
503 Joe Carroll St Tahlequah, OK 74464
Estimated Value: $220,000 - $243,000
4
Beds
2
Baths
2,120
Sq Ft
$108/Sq Ft
Est. Value
About This Home
This home is located at 503 Joe Carroll St, Tahlequah, OK 74464 and is currently estimated at $229,330, approximately $108 per square foot. 503 Joe Carroll St is a home located in Cherokee County with nearby schools including Cherokee Elementary School, Greenwood Elementary School, and Tahlequah Middle School.
Ownership History
Date
Name
Owned For
Owner Type
Purchase Details
Closed on
Jan 6, 2012
Sold by
Bryant Deborah M and Bryant Charlie C
Bought by
Kester Brian S and Kester Chelsea
Current Estimated Value
Home Financials for this Owner
Home Financials are based on the most recent Mortgage that was taken out on this home.
Original Mortgage
$135,935
Outstanding Balance
$93,078
Interest Rate
4.03%
Mortgage Type
VA
Estimated Equity
$136,252
Purchase Details
Closed on
Nov 4, 2005
Sold by
Anderson Lori J
Bought by
Brandt Will and Brandt Beth
Home Financials for this Owner
Home Financials are based on the most recent Mortgage that was taken out on this home.
Original Mortgage
$82,800
Interest Rate
9.25%
Mortgage Type
Assumption
Purchase Details
Closed on
Jul 11, 1994
Sold by
Rocky Lynn Weston
Bought by
Lori J Anderson
Create a Home Valuation Report for This Property
The Home Valuation Report is an in-depth analysis detailing your home's value as well as a comparison with similar homes in the area
Home Values in the Area
Average Home Value in this Area
Purchase History
| Date | Buyer | Sale Price | Title Company |
|---|---|---|---|
| Kester Brian S | $74,500 | None Available | |
| Brandt Will | $92,000 | Amehcan Eagle Title Insuranc | |
| Anderson Lori J | -- | Amerlaan Eagle Titfe Insuran | |
| Lori J Anderson | $65,000 | -- |
Source: Public Records
Mortgage History
| Date | Status | Borrower | Loan Amount |
|---|---|---|---|
| Open | Kester Brian S | $135,935 | |
| Previous Owner | Brandt Will | $82,800 |
Source: Public Records
Tax History Compared to Growth
Tax History
| Year | Tax Paid | Tax Assessment Tax Assessment Total Assessment is a certain percentage of the fair market value that is determined by local assessors to be the total taxable value of land and additions on the property. | Land | Improvement |
|---|---|---|---|---|
| 2025 | $949 | $11,343 | $1,292 | $10,051 |
| 2024 | $949 | $11,013 | $1,255 | $9,758 |
| 2023 | $949 | $10,692 | $1,167 | $9,525 |
| 2022 | $870 | $10,381 | $1,167 | $9,214 |
| 2021 | $845 | $10,079 | $1,167 | $8,912 |
| 2020 | $833 | $9,785 | $1,167 | $8,618 |
| 2019 | $799 | $9,500 | $1,167 | $8,333 |
| 2018 | $782 | $9,224 | $1,167 | $8,057 |
| 2017 | $755 | $8,955 | $1,167 | $7,788 |
| 2016 | $735 | $8,694 | $1,167 | $7,527 |
| 2015 | $698 | $8,441 | $1,167 | $7,274 |
| 2014 | $677 | $8,195 | $1,167 | $7,028 |
Source: Public Records
Map
Nearby Homes
- 425 E Seneca St
- 920 Francis Ave
- 112 W Allen Rd
- 707 Victor St
- 717 N Oklahoma Ave
- 249 W Patti June St
- 2020 N Everly Dr
- 2021 N Everly Dr
- 1930 N Everly Dr
- 2030 N Everly Dr
- 2031 N Everly Dr
- 2040 N Everly Dr
- 640 N Oklahoma Ave
- 1408 Trimble Ave
- 510 Talley St
- 1406 Skipper Ave
- 1450 E Allen Rd
- 310 York St
- 605 E Ward St
- 609 E Ward St