Estimated Value: $230,000 - $239,485
3
Beds
2
Baths
1,426
Sq Ft
$165/Sq Ft
Est. Value
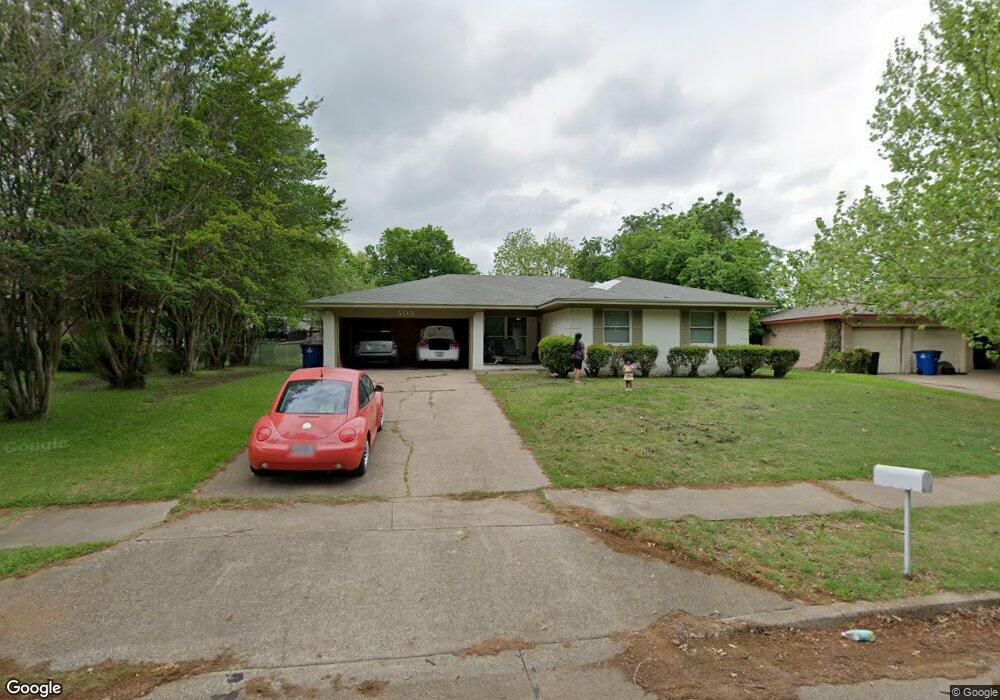
About This Home
This home is located at 503 Lakeshore Dr, Ennis, TX 75119 and is currently estimated at $234,743, approximately $164 per square foot. 503 Lakeshore Dr is a home located in Ellis County with nearby schools including Austin Elementary School, Dorie Miller Int, and Ennis Junior High School.
Ownership History
Date
Name
Owned For
Owner Type
Purchase Details
Closed on
Feb 21, 2018
Sold by
Prachyl Carl Lynn and Prachyl Kelly D
Bought by
Daniels Tommy G
Current Estimated Value
Home Financials for this Owner
Home Financials are based on the most recent Mortgage that was taken out on this home.
Original Mortgage
$143,355
Outstanding Balance
$123,643
Interest Rate
4.75%
Mortgage Type
FHA
Estimated Equity
$111,100
Purchase Details
Closed on
Jan 9, 2017
Sold by
Prachyl Carl Lynn and Prachyl Kelly D
Bought by
Prachyl Kelly D and Prachyl Carl Lynn
Home Financials for this Owner
Home Financials are based on the most recent Mortgage that was taken out on this home.
Original Mortgage
$51,600
Interest Rate
4.08%
Mortgage Type
Credit Line Revolving
Purchase Details
Closed on
May 13, 2004
Sold by
Prachyl Carl Lynn
Bought by
Prachyl Leisha K
Create a Home Valuation Report for This Property
The Home Valuation Report is an in-depth analysis detailing your home's value as well as a comparison with similar homes in the area
Home Values in the Area
Average Home Value in this Area
Purchase History
| Date | Buyer | Sale Price | Title Company |
|---|---|---|---|
| Daniels Tommy G | -- | Providence Title Company | |
| Prachyl Kelly D | -- | Lawyers Title | |
| Prachyl Leisha K | -- | None Available |
Source: Public Records
Mortgage History
| Date | Status | Borrower | Loan Amount |
|---|---|---|---|
| Open | Daniels Tommy G | $143,355 | |
| Previous Owner | Prachyl Kelly D | $51,600 |
Source: Public Records
Tax History Compared to Growth
Tax History
| Year | Tax Paid | Tax Assessment Tax Assessment Total Assessment is a certain percentage of the fair market value that is determined by local assessors to be the total taxable value of land and additions on the property. | Land | Improvement |
|---|---|---|---|---|
| 2025 | $4,609 | $233,884 | $65,000 | $168,884 |
| 2024 | $4,609 | $214,050 | $60,000 | $154,050 |
| 2023 | $4,609 | $230,317 | $60,000 | $170,317 |
| 2022 | $4,587 | $191,665 | $44,000 | $147,665 |
| 2021 | $4,298 | $170,720 | $35,000 | $135,720 |
| 2020 | $3,903 | $151,670 | $30,000 | $121,670 |
| 2019 | $3,775 | $144,040 | $0 | $0 |
| 2018 | $2,120 | $92,620 | $20,000 | $72,620 |
| 2017 | $1,937 | $73,020 | $18,000 | $55,020 |
| 2016 | $1,932 | $72,830 | $18,000 | $54,830 |
| 2015 | $1,866 | $70,420 | $18,000 | $52,420 |
| 2014 | $1,866 | $70,440 | $0 | $0 |
Source: Public Records
Map
Nearby Homes
- 507 Lakeshore Dr
- 536 Lakeshore Dr
- 805 Loy Ln
- 2410 Linda Dr
- 3712 Kings Dr
- 1509 Lyndale Dr
- 2308 Louise Ln
- 206 Houston St
- 2800 Boyd St
- 1207 Louise Ln
- 2900 Boyd St
- 1106 N Mckinney St
- 707 Oakmont Dr
- 1103 Sunset Dr
- 1206 N Kaufman St
- 1311 Daffan Ave
- 1408 N Johnson St
- 1308 Daffan Ave
- 811 N Gaines St
- 2810 Belmont Dr
- 501 Lakeshore Dr
- 508 Cherry Ln
- 504 Cherry Ln
- 509 Lakeshore Dr
- 512 Cherry Ln
- 500 Cherry Ln
- 516 Cherry Ln
- 502 Lakeshore Dr
- 500 Lakeshore Dr
- 506 Lakeshore Dr
- 513 Lakeshore Dr
- 520 Cherry Ln
- 510 Lakeshore Dr
- 524 Cherry Ln
- 517 Lakeshore Dr
- 514 Lakeshore Dr
- 503 Cherry Ln
- 507 Cherry Ln
- 509 Cherry Ln
- 501 Cherry Ln