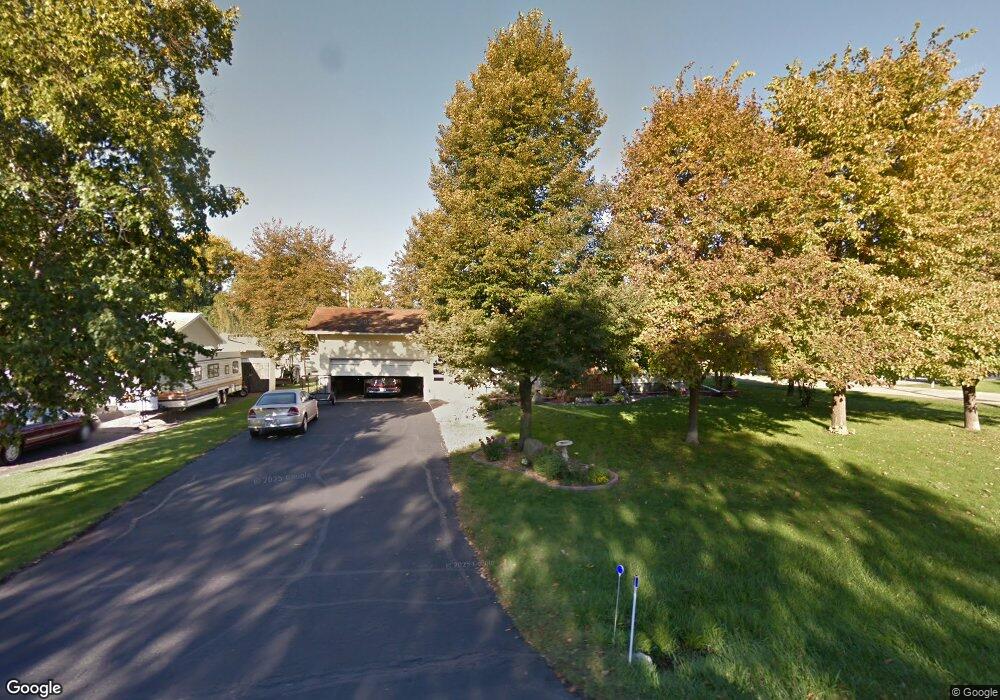
503 Lund Ave Glyndon, ND 56547
Estimated Value: $248,000 - $325,000
5
Beds
2
Baths
1,286
Sq Ft
$230/Sq Ft
Est. Value
About This Home
This home is located at 503 Lund Ave, Glyndon, ND 56547 and is currently estimated at $295,605, approximately $229 per square foot. 503 Lund Ave is a home located in Clay County with nearby schools including Dilworth-Glyndon-Felton Middle School and Dilworth-Glyndon-Felton Senior High School.
Ownership History
Date
Name
Owned For
Owner Type
Purchase Details
Closed on
Jan 7, 2008
Sold by
Muhle Leroy E and Muhle Lorraine
Bought by
Kram Ronald L and Kram Connie
Current Estimated Value
Home Financials for this Owner
Home Financials are based on the most recent Mortgage that was taken out on this home.
Original Mortgage
$142,900
Outstanding Balance
$89,209
Interest Rate
5.95%
Mortgage Type
VA
Estimated Equity
$206,396
Create a Home Valuation Report for This Property
The Home Valuation Report is an in-depth analysis detailing your home's value as well as a comparison with similar homes in the area
Home Values in the Area
Average Home Value in this Area
Purchase History
| Date | Buyer | Sale Price | Title Company |
|---|---|---|---|
| Kram Ronald L | $139,900 | None Available |
Source: Public Records
Mortgage History
| Date | Status | Borrower | Loan Amount |
|---|---|---|---|
| Open | Kram Ronald L | $142,900 |
Source: Public Records
Tax History Compared to Growth
Tax History
| Year | Tax Paid | Tax Assessment Tax Assessment Total Assessment is a certain percentage of the fair market value that is determined by local assessors to be the total taxable value of land and additions on the property. | Land | Improvement |
|---|---|---|---|---|
| 2025 | $3,900 | $281,300 | $30,000 | $251,300 |
| 2024 | $3,900 | $287,300 | $30,000 | $257,300 |
| 2023 | $3,732 | $276,300 | $30,000 | $246,300 |
| 2022 | $3,224 | $250,000 | $30,000 | $220,000 |
| 2021 | $2,728 | $200,600 | $30,000 | $170,600 |
| 2020 | $2,522 | $175,000 | $30,000 | $145,000 |
| 2019 | $2,360 | $164,900 | $30,000 | $134,900 |
| 2018 | $2,546 | $159,400 | $30,000 | $129,400 |
| 2017 | $2,460 | $172,500 | $25,500 | $147,000 |
| 2016 | $2,378 | $156,300 | $15,000 | $141,300 |
| 2015 | $2,302 | $143,200 | $15,000 | $128,200 |
| 2014 | $2,270 | $143,200 | $15,000 | $128,200 |
Source: Public Records
Map
Nearby Homes