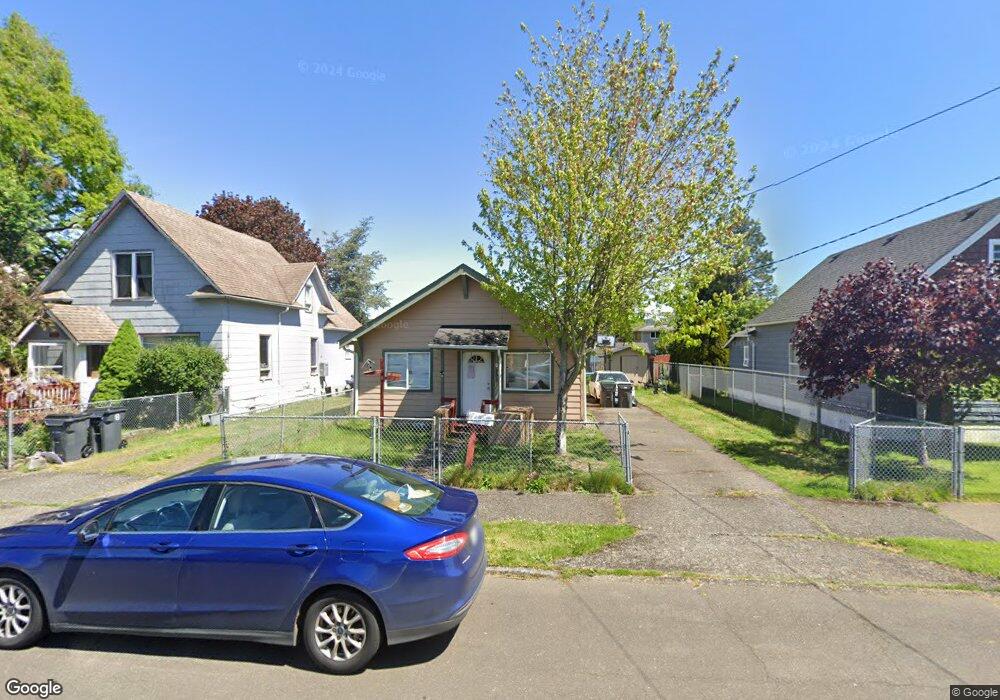
503 M St Hoquiam, WA 98550
Estimated Value: $309,000 - $347,000
3
Beds
2
Baths
1,224
Sq Ft
$269/Sq Ft
Est. Value
About This Home
This home is located at 503 M St, Hoquiam, WA 98550 and is currently estimated at $328,861, approximately $268 per square foot. 503 M St is a home located in Grays Harbor County with nearby schools including Lincoln Elementary School, Emerson Elementary School, and Central Elementary School.
Ownership History
Date
Name
Owned For
Owner Type
Purchase Details
Closed on
Sep 26, 2011
Sold by
Federal Home Loan Mortgage Corporation
Bought by
Hansen Tyler E
Current Estimated Value
Home Financials for this Owner
Home Financials are based on the most recent Mortgage that was taken out on this home.
Original Mortgage
$73,056
Outstanding Balance
$49,803
Interest Rate
4.09%
Mortgage Type
New Conventional
Estimated Equity
$279,058
Purchase Details
Closed on
Oct 12, 2010
Sold by
Shenk Rutledge Christian and Shenk Rutledge Alexa
Bought by
Federal Home Loan Mortgage Corp
Purchase Details
Closed on
May 2, 2005
Sold by
Hartley Eric
Bought by
Shenk Rutledge Christian and Shenk Rutledge Alexa
Home Financials for this Owner
Home Financials are based on the most recent Mortgage that was taken out on this home.
Original Mortgage
$114,400
Interest Rate
6.5%
Mortgage Type
Adjustable Rate Mortgage/ARM
Create a Home Valuation Report for This Property
The Home Valuation Report is an in-depth analysis detailing your home's value as well as a comparison with similar homes in the area
Purchase History
| Date | Buyer | Sale Price | Title Company |
|---|---|---|---|
| Hansen Tyler E | -- | Coast Title | |
| Federal Home Loan Mortgage Corp | $121,675 | Grays Harbor Title | |
| Shenk Rutledge Christian | $142,673 | Coast Title |
Source: Public Records
Mortgage History
| Date | Status | Borrower | Loan Amount |
|---|---|---|---|
| Open | Hansen Tyler E | $73,056 | |
| Previous Owner | Shenk Rutledge Christian | $114,400 |
Source: Public Records
Tax History
| Year | Tax Paid | Tax Assessment Tax Assessment Total Assessment is a certain percentage of the fair market value that is determined by local assessors to be the total taxable value of land and additions on the property. | Land | Improvement |
|---|---|---|---|---|
| 2025 | $2,254 | $246,494 | $52,070 | $194,424 |
| 2023 | $2,120 | $251,647 | $41,325 | $210,322 |
| 2022 | $2,171 | $196,966 | $28,500 | $168,466 |
| 2021 | $1,738 | $196,966 | $28,500 | $168,466 |
| 2020 | $1,614 | $143,550 | $28,500 | $115,050 |
| 2019 | $1,287 | $128,543 | $28,500 | $100,043 |
| 2018 | $1,290 | $107,119 | $23,750 | $83,369 |
| 2017 | $1,169 | $85,505 | $23,750 | $61,755 |
| 2016 | $960 | $80,505 | $18,750 | $61,755 |
| 2014 | -- | $66,930 | $18,750 | $48,180 |
| 2013 | -- | $72,760 | $25,000 | $47,760 |
Source: Public Records
Map
Nearby Homes
Your Personal Tour Guide
Ask me questions while you tour the home.