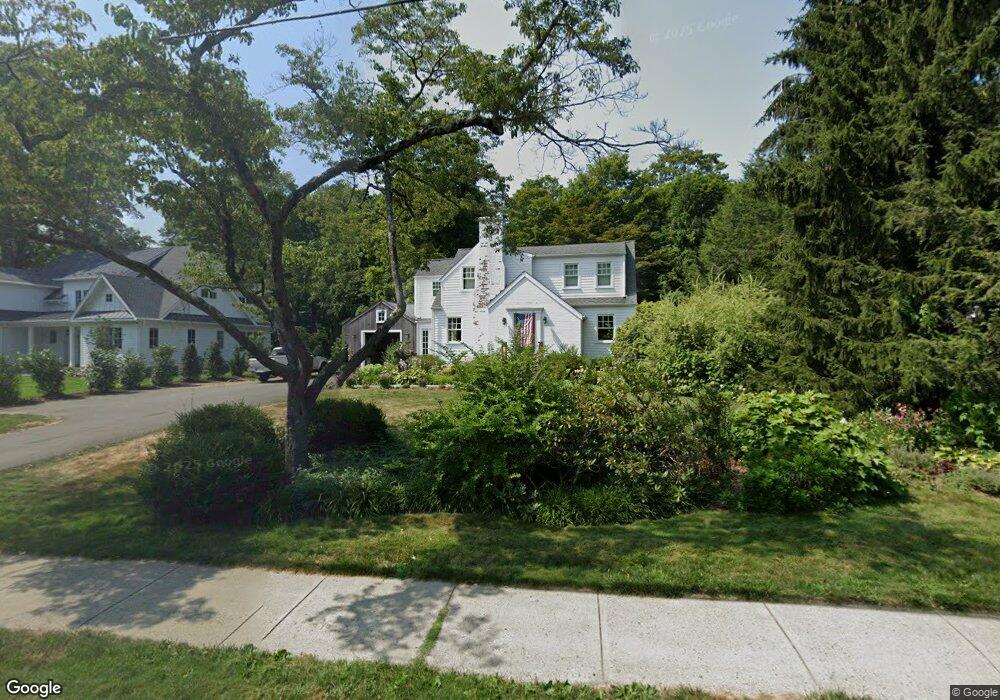
503 Main St New Canaan, CT 06840
Estimated Value: $1,369,000 - $1,778,660
3
Beds
3
Baths
2,208
Sq Ft
$698/Sq Ft
Est. Value
About This Home
This home is located at 503 Main St, New Canaan, CT 06840 and is currently estimated at $1,540,915, approximately $697 per square foot. 503 Main St is a home located in Fairfield County with nearby schools including South Elementary School, Saxe Middle School, and New Canaan High School.
Ownership History
Date
Name
Owned For
Owner Type
Purchase Details
Closed on
Nov 12, 2008
Sold by
Young Kai Uwe
Bought by
Ferrante Lisa
Current Estimated Value
Purchase Details
Closed on
Sep 12, 2005
Sold by
Farnham Elmerinda and Saxe Patricia Depret
Bought by
Young Kai Uwe
Home Financials for this Owner
Home Financials are based on the most recent Mortgage that was taken out on this home.
Original Mortgage
$720,000
Interest Rate
7.49%
Purchase Details
Closed on
Feb 6, 2004
Sold by
Est Depreta Anna M and Dademo Longetta J
Bought by
Farnham Elmerinda and Saxe Patricia Depret
Home Financials for this Owner
Home Financials are based on the most recent Mortgage that was taken out on this home.
Original Mortgage
$400,000
Interest Rate
5.71%
Create a Home Valuation Report for This Property
The Home Valuation Report is an in-depth analysis detailing your home's value as well as a comparison with similar homes in the area
Home Values in the Area
Average Home Value in this Area
Purchase History
| Date | Buyer | Sale Price | Title Company |
|---|---|---|---|
| Ferrante Lisa | $440,000 | -- | |
| Young Kai Uwe | $900,000 | -- | |
| Farnham Elmerinda | $585,000 | -- |
Source: Public Records
Mortgage History
| Date | Status | Borrower | Loan Amount |
|---|---|---|---|
| Open | Farnham Elmerinda | $568,000 | |
| Closed | Farnham Elmerinda | $585,000 | |
| Previous Owner | Farnham Elmerinda | $720,000 | |
| Previous Owner | Farnham Elmerinda | $400,000 |
Source: Public Records
Tax History Compared to Growth
Tax History
| Year | Tax Paid | Tax Assessment Tax Assessment Total Assessment is a certain percentage of the fair market value that is determined by local assessors to be the total taxable value of land and additions on the property. | Land | Improvement |
|---|---|---|---|---|
| 2025 | $13,566 | $812,840 | $540,960 | $271,880 |
| 2024 | $13,119 | $812,840 | $540,960 | $271,880 |
| 2023 | $12,150 | $641,480 | $481,040 | $160,440 |
| 2022 | $11,784 | $641,480 | $481,040 | $160,440 |
| 2021 | $11,649 | $641,480 | $481,040 | $160,440 |
| 2020 | $11,649 | $641,480 | $481,040 | $160,440 |
| 2019 | $11,701 | $641,480 | $481,040 | $160,440 |
| 2018 | $11,971 | $705,810 | $445,410 | $260,400 |
| 2017 | $11,766 | $705,810 | $445,410 | $260,400 |
| 2016 | $11,512 | $705,810 | $445,410 | $260,400 |
| 2015 | $11,286 | $705,810 | $445,410 | $260,400 |
| 2014 | $10,968 | $705,810 | $445,410 | $260,400 |
Source: Public Records
Map
Nearby Homes
- 12 Lincoln Dr
- 31 Selleck Place
- 354 South Ave
- 50 Harrison Ave
- 25 Gower Rd
- 44 Putnam Rd
- 52 Putnam Rd
- 216 White Oak Shade Rd
- 180 Summer St
- 317 Park St
- 38 Fitch Ln
- 184 Marvin Ridge Rd
- 63 Middle Ridge Rd
- 197 Park St Unit 13
- 15 Burtis Ave Unit Townhome D
- 15 Burtis Ave Unit West Penthouse B
- 15 Burtis Ave Unit East Penthouse C
- 15 Burtis Ave Unit Townhome A
- 15 Burtis Ave Unit East Plaza 203
- 289 New Norwalk Rd Unit 22