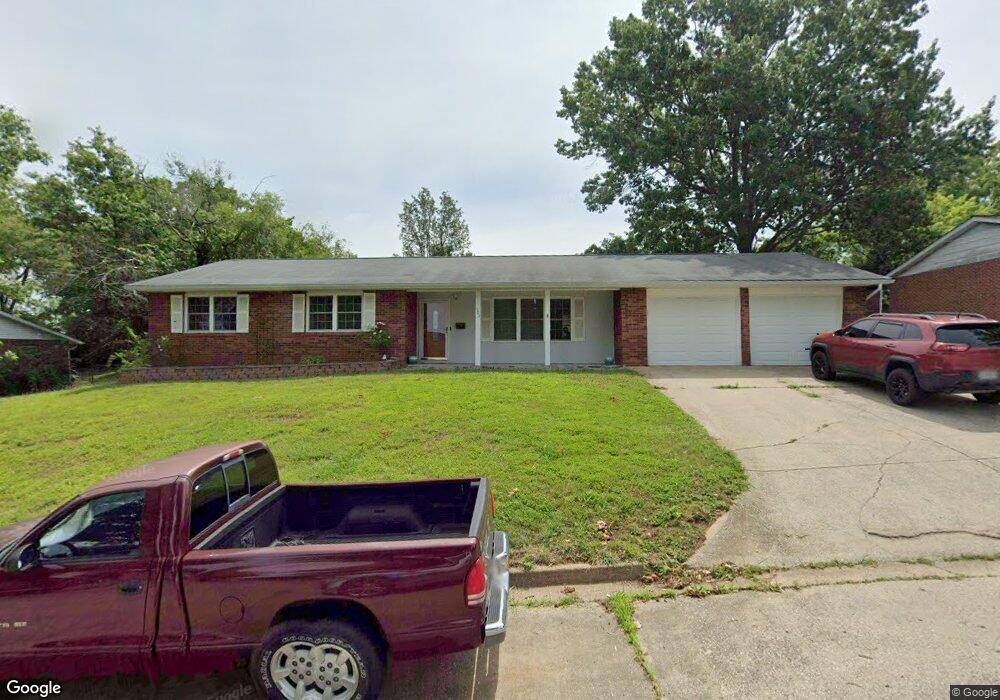
503 N 12th St de Soto, MO 63020
Estimated Value: $224,000 - $251,526
3
Beds
2
Baths
1,383
Sq Ft
$174/Sq Ft
Est. Value
About This Home
This home is located at 503 N 12th St, de Soto, MO 63020 and is currently estimated at $241,132, approximately $174 per square foot. 503 N 12th St is a home located in Jefferson County with nearby schools including De Soto Senior High School and St Rose Of Lima School.
Ownership History
Date
Name
Owned For
Owner Type
Purchase Details
Closed on
Jan 29, 2008
Sold by
Davis Scott R
Bought by
Davis Scott R and Davis Amanda
Current Estimated Value
Purchase Details
Closed on
Feb 23, 2004
Sold by
Grobe Darrell W and Grobe Nancy J
Bought by
Davis Scott R
Home Financials for this Owner
Home Financials are based on the most recent Mortgage that was taken out on this home.
Original Mortgage
$105,839
Outstanding Balance
$49,742
Interest Rate
5.86%
Mortgage Type
FHA
Estimated Equity
$191,390
Purchase Details
Closed on
Feb 13, 2004
Sold by
Grobe Timothy W and Grobe Trina
Bought by
Grobe Darrell W and Grobe Nancy J
Home Financials for this Owner
Home Financials are based on the most recent Mortgage that was taken out on this home.
Original Mortgage
$105,839
Outstanding Balance
$49,742
Interest Rate
5.86%
Mortgage Type
FHA
Estimated Equity
$191,390
Purchase Details
Closed on
Jan 2, 1997
Sold by
Liverar Bryan D and Liverar Wilma E
Bought by
Grobe Darrell W and Grobe Nancy J
Create a Home Valuation Report for This Property
The Home Valuation Report is an in-depth analysis detailing your home's value as well as a comparison with similar homes in the area
Home Values in the Area
Average Home Value in this Area
Purchase History
| Date | Buyer | Sale Price | Title Company |
|---|---|---|---|
| Davis Scott R | -- | None Available | |
| Davis Scott R | -- | -- | |
| Grobe Darrell W | -- | -- | |
| Grobe Darrell W | -- | -- |
Source: Public Records
Mortgage History
| Date | Status | Borrower | Loan Amount |
|---|---|---|---|
| Open | Davis Scott R | $105,839 |
Source: Public Records
Tax History Compared to Growth
Tax History
| Year | Tax Paid | Tax Assessment Tax Assessment Total Assessment is a certain percentage of the fair market value that is determined by local assessors to be the total taxable value of land and additions on the property. | Land | Improvement |
|---|---|---|---|---|
| 2025 | $1,481 | $24,900 | $1,800 | $23,100 |
| 2024 | $1,481 | $23,100 | $1,800 | $21,300 |
| 2023 | $1,481 | $23,100 | $1,800 | $21,300 |
| 2022 | $1,472 | $23,000 | $1,800 | $21,200 |
| 2021 | $1,470 | $23,000 | $1,800 | $21,200 |
| 2020 | $1,336 | $20,500 | $1,400 | $19,100 |
| 2019 | $1,335 | $20,500 | $1,400 | $19,100 |
| 2018 | $1,301 | $20,500 | $1,400 | $19,100 |
| 2017 | $1,297 | $20,500 | $1,400 | $19,100 |
| 2016 | $1,178 | $18,300 | $1,300 | $17,000 |
| 2015 | $1,171 | $18,300 | $1,300 | $17,000 |
| 2013 | -- | $17,900 | $1,300 | $16,600 |
Source: Public Records
Map
Nearby Homes
- 517 N 11th St
- 407 N 11th St
- 358 N Thomas St
- 350 N Thomas St
- 1208 Boyd St
- 306 N Thomas St
- 1533 Hickory Landing
- 1535 Hickory Landing
- 1551 Hickory Landing
- 3 Easton St
- 1553 Hickory Landing
- 1561 Hickory Landing
- 600 Allen Place
- 115 N 5th St
- 4 Easton St
- 513 W Mineral St
- 1504 Essex Heights Dr
- 609 W Clement St
- 422 N 2nd St
- 821 N 3rd St