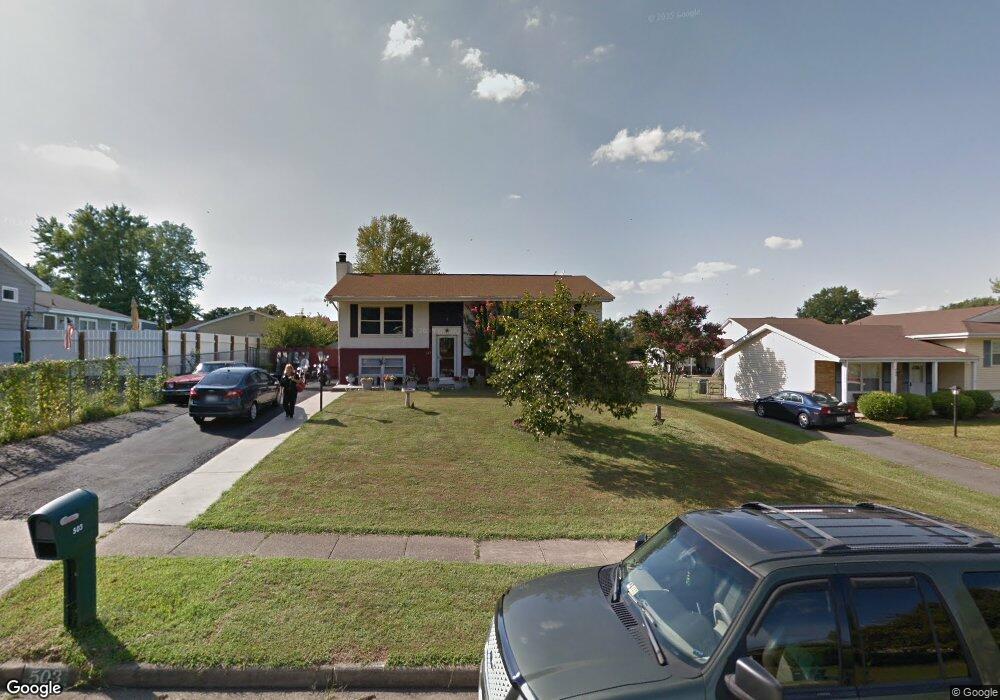
503 N Alder Ave Sterling, VA 20164
Estimated Value: $484,000 - $626,000
6
Beds
3
Baths
1,084
Sq Ft
$532/Sq Ft
Est. Value
About This Home
This home is located at 503 N Alder Ave, Sterling, VA 20164 and is currently estimated at $576,260, approximately $531 per square foot. 503 N Alder Ave is a home located in Loudoun County with nearby schools including Sterling Elementary School, Sterling Middle School, and Park View High School.
Ownership History
Date
Name
Owned For
Owner Type
Purchase Details
Closed on
Jan 21, 2015
Sold by
Mcdaniel Betty and Mcdaniel Jeremiah
Bought by
Mcdaniel Betty
Current Estimated Value
Home Financials for this Owner
Home Financials are based on the most recent Mortgage that was taken out on this home.
Original Mortgage
$262,500
Outstanding Balance
$201,950
Interest Rate
3.96%
Mortgage Type
New Conventional
Estimated Equity
$374,310
Purchase Details
Closed on
Sep 8, 2008
Sold by
The Bk Of New York Succ T
Bought by
Mcdaniel Jeremiah
Home Financials for this Owner
Home Financials are based on the most recent Mortgage that was taken out on this home.
Original Mortgage
$255,983
Interest Rate
6.69%
Mortgage Type
FHA
Purchase Details
Closed on
Jul 27, 2005
Sold by
Vu Khoa
Bought by
Buruca Oscar A Alvarez
Home Financials for this Owner
Home Financials are based on the most recent Mortgage that was taken out on this home.
Original Mortgage
$359,650
Interest Rate
5.67%
Mortgage Type
New Conventional
Create a Home Valuation Report for This Property
The Home Valuation Report is an in-depth analysis detailing your home's value as well as a comparison with similar homes in the area
Home Values in the Area
Average Home Value in this Area
Purchase History
| Date | Buyer | Sale Price | Title Company |
|---|---|---|---|
| Mcdaniel Betty | -- | -- | |
| Mcdaniel Jeremiah | $260,000 | -- | |
| Buruca Oscar A Alvarez | $479,900 | -- |
Source: Public Records
Mortgage History
| Date | Status | Borrower | Loan Amount |
|---|---|---|---|
| Open | Mcdaniel Betty | $262,500 | |
| Previous Owner | Mcdaniel Jeremiah | $255,983 | |
| Previous Owner | Buruca Oscar A Alvarez | $359,650 |
Source: Public Records
Tax History
| Year | Tax Paid | Tax Assessment Tax Assessment Total Assessment is a certain percentage of the fair market value that is determined by local assessors to be the total taxable value of land and additions on the property. | Land | Improvement |
|---|---|---|---|---|
| 2025 | $4,750 | $590,070 | $234,100 | $355,970 |
| 2024 | $4,659 | $538,650 | $209,100 | $329,550 |
| 2023 | $4,405 | $503,450 | $209,100 | $294,350 |
| 2022 | $4,224 | $474,650 | $189,100 | $285,550 |
| 2021 | $4,201 | $428,650 | $179,100 | $249,550 |
| 2020 | $4,209 | $406,620 | $154,100 | $252,520 |
| 2019 | $4,129 | $395,140 | $154,100 | $241,040 |
| 2018 | $3,898 | $359,260 | $139,100 | $220,160 |
| 2017 | $3,906 | $347,210 | $139,100 | $208,110 |
| 2016 | $3,765 | $328,790 | $0 | $0 |
| 2015 | $3,417 | $180,440 | $0 | $180,440 |
| 2014 | $3,363 | $170,580 | $0 | $170,580 |
Source: Public Records
Map
Nearby Homes
- 301 N Alder Ave
- 303 N Argonne Ave
- 308 E Cornell Dr
- 133 N Baylor Dr Unit 97
- 709 N Belfort St
- 221 N Emory Dr Unit 8
- 115 N Duke Dr
- 141 N Fillmore Ave Unit 10
- 107 N Aspen Ave
- 108 N Garfield Rd
- 102 Evergreen St
- 138 N Ithaca Ct
- 1201 E Holly Ave
- 125 N Lincoln Ave
- 1314 E Holly Ave
- 112 N Kennedy Rd
- 207 N Laura Anne Dr
- 211 Amy Ct
- 46337 Reddish Knob Dr
- 21039 Barcroft Way
- 505 N Alder Ave
- 500 N York Rd
- 502 N York Rd
- 507 N Alder Ave
- 508 N Brighton Ct
- 506 N Brighton Ct
- 504 N York Rd
- 500 N Alder Ave
- 502 N Alder Ave
- 412 N Alder Ave
- 504 N Alder Ave
- 509 N Alder Ave
- 510 N Brighton Ct
- 405 N Alder Ave
- 506 N York Rd
- 410 N Alder Ave
- 507 N Brighton Ct
- 506 N Alder Ave
- 409 N York Rd
- 505 N Sterling Blvd
Your Personal Tour Guide
Ask me questions while you tour the home.