Estimated Value: $136,000 - $154,000
2
Beds
1
Bath
1,040
Sq Ft
$137/Sq Ft
Est. Value
About This Home
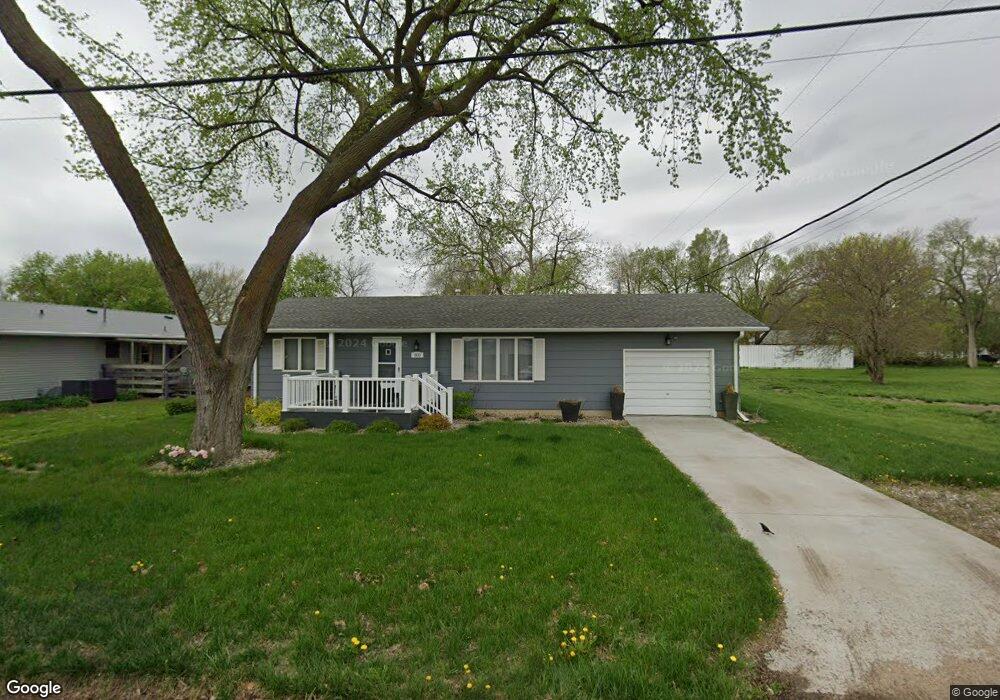
This home is located at 503 N B St, Edgar, NE 68935 and is currently estimated at $142,605, approximately $137 per square foot. 503 N B St is a home located in Clay County.
Ownership History
Date
Name
Owned For
Owner Type
Purchase Details
Closed on
Jul 17, 2020
Sold by
Maynard Pamela J
Bought by
Greer Sarah N
Current Estimated Value
Purchase Details
Closed on
Jun 2, 2016
Sold by
Musgrave Eric and Musgrave April
Bought by
Maynard Pamela J
Purchase Details
Closed on
Aug 3, 2010
Sold by
Schlichtman Margaret V and Schlichtman William
Bought by
Musgrave Eric
Create a Home Valuation Report for This Property
The Home Valuation Report is an in-depth analysis detailing your home's value as well as a comparison with similar homes in the area
Home Values in the Area
Average Home Value in this Area
Purchase History
| Date | Buyer | Sale Price | Title Company |
|---|---|---|---|
| Greer Sarah N | $95,000 | Adams Land Title Company | |
| Maynard Pamela J | $22,000 | None Available | |
| Musgrave Eric | $20,000 | -- |
Source: Public Records
Tax History Compared to Growth
Tax History
| Year | Tax Paid | Tax Assessment Tax Assessment Total Assessment is a certain percentage of the fair market value that is determined by local assessors to be the total taxable value of land and additions on the property. | Land | Improvement |
|---|---|---|---|---|
| 2025 | $2,042 | $109,840 | $3,960 | $105,880 |
| 2024 | $2,042 | $102,225 | $3,025 | $99,200 |
| 2023 | $1,473 | $95,850 | $3,025 | $92,825 |
| 2022 | $1,540 | $92,015 | $1,010 | $91,005 |
| 2021 | $1,424 | $82,995 | $1,010 | $81,985 |
| 2020 | $687 | $40,270 | $965 | $39,305 |
| 2019 | $564 | $33,450 | $965 | $32,485 |
| 2018 | $473 | $30,340 | $965 | $29,375 |
| 2017 | $521 | $36,135 | $965 | $35,170 |
| 2016 | $496 | $36,135 | $965 | $35,170 |
| 2015 | $549 | $36,605 | $900 | $35,705 |
| 2014 | $748 | $36,605 | $900 | $35,705 |
| 2013 | $748 | $36,605 | $900 | $35,705 |
Source: Public Records
Map
Nearby Homes
- 401 N A St
- 508 4th St
- 803 6th St
- 30151 Hwy 14 Fairfield Rd
- ROAD W Road W and 4200
- ROAD W Road W and 4300 Rd
- NONE Road W and 4200
- 302 and 304 Main St
- 406 N Linden Ave
- 801 E 6th St
- 31020 Road L County Rd
- 0 Pheasant View Lots
- 416 W South St
- 108 W Glenvil St
- 510 N Clay Ave
- 421 N Brown Ave
- 250 W 1st St
- 135 W 2nd St
- 801 Saltzman Dr
- 504 N Plum St