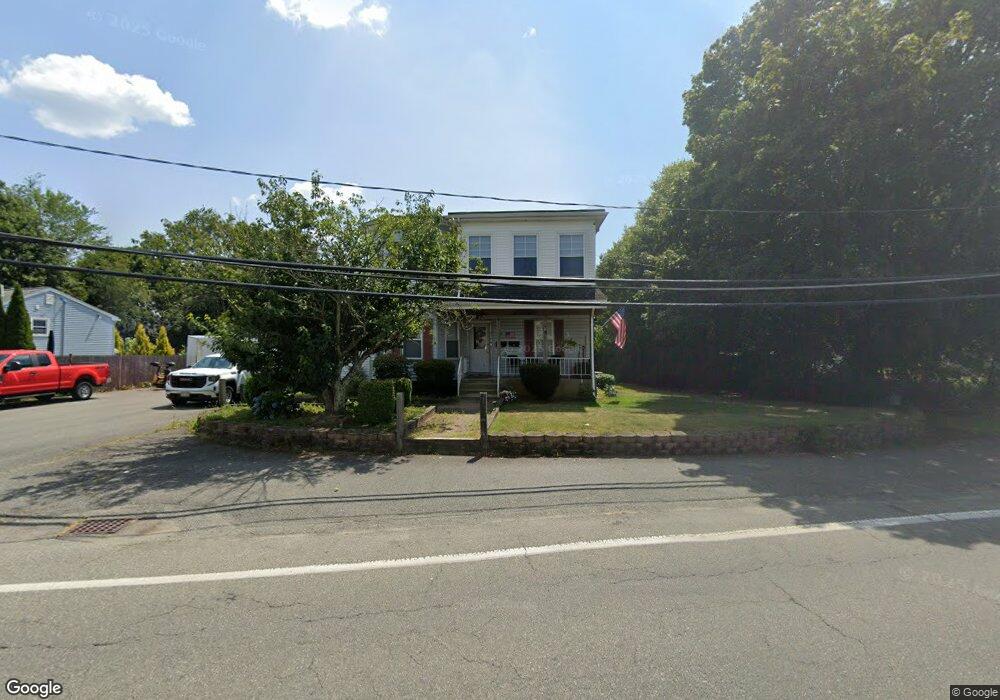
503 N Cary St Brockton, MA 02302
Montello NeighborhoodEstimated Value: $580,000 - $971,000
4
Beds
2
Baths
4,000
Sq Ft
$190/Sq Ft
Est. Value
About This Home
This home is located at 503 N Cary St, Brockton, MA 02302 and is currently estimated at $758,134, approximately $189 per square foot. 503 N Cary St is a home located in Plymouth County with nearby schools including Brookfield Elementary School, Downey Elementary School, and Ashfield Middle School.
Ownership History
Date
Name
Owned For
Owner Type
Purchase Details
Closed on
Mar 27, 2017
Sold by
Smith Ann L
Bought by
Pierce Harold W
Current Estimated Value
Purchase Details
Closed on
Sep 11, 1992
Sold by
Fed Natl Mtg Assn
Bought by
Pierce Sharon M and Dossantos Joan M
Purchase Details
Closed on
Jun 10, 1992
Sold by
Brown Harvey G
Bought by
Federal National Mortgage Association
Purchase Details
Closed on
Mar 3, 1987
Sold by
Clark Michael F
Bought by
Spieler Laurie
Create a Home Valuation Report for This Property
The Home Valuation Report is an in-depth analysis detailing your home's value as well as a comparison with similar homes in the area
Home Values in the Area
Average Home Value in this Area
Purchase History
| Date | Buyer | Sale Price | Title Company |
|---|---|---|---|
| Pierce Harold W | -- | -- | |
| Pierce Sharon M | $61,900 | -- | |
| Federal National Mortgage Association | $149,500 | -- | |
| Spieler Laurie | $115,000 | -- |
Source: Public Records
Mortgage History
| Date | Status | Borrower | Loan Amount |
|---|---|---|---|
| Previous Owner | Spieler Laurie | $290,000 | |
| Previous Owner | Spieler Laurie | $40,000 |
Source: Public Records
Tax History Compared to Growth
Tax History
| Year | Tax Paid | Tax Assessment Tax Assessment Total Assessment is a certain percentage of the fair market value that is determined by local assessors to be the total taxable value of land and additions on the property. | Land | Improvement |
|---|---|---|---|---|
| 2025 | $9,792 | $808,600 | $167,700 | $640,900 |
| 2024 | $9,297 | $773,500 | $167,700 | $605,800 |
| 2023 | $9,883 | $761,400 | $134,200 | $627,200 |
| 2022 | $8,689 | $622,000 | $122,700 | $499,300 |
| 2021 | $9,190 | $633,800 | $109,400 | $524,400 |
| 2020 | $7,583 | $500,500 | $104,800 | $395,700 |
| 2019 | $5,921 | $381,000 | $97,200 | $283,800 |
| 2018 | $6,496 | $404,500 | $97,200 | $307,300 |
| 2017 | $5,804 | $360,500 | $97,200 | $263,300 |
| 2016 | $5,677 | $327,000 | $93,900 | $233,100 |
| 2015 | $5,285 | $291,200 | $93,900 | $197,300 |
| 2014 | $5,381 | $296,800 | $93,900 | $202,900 |
Source: Public Records
Map
Nearby Homes