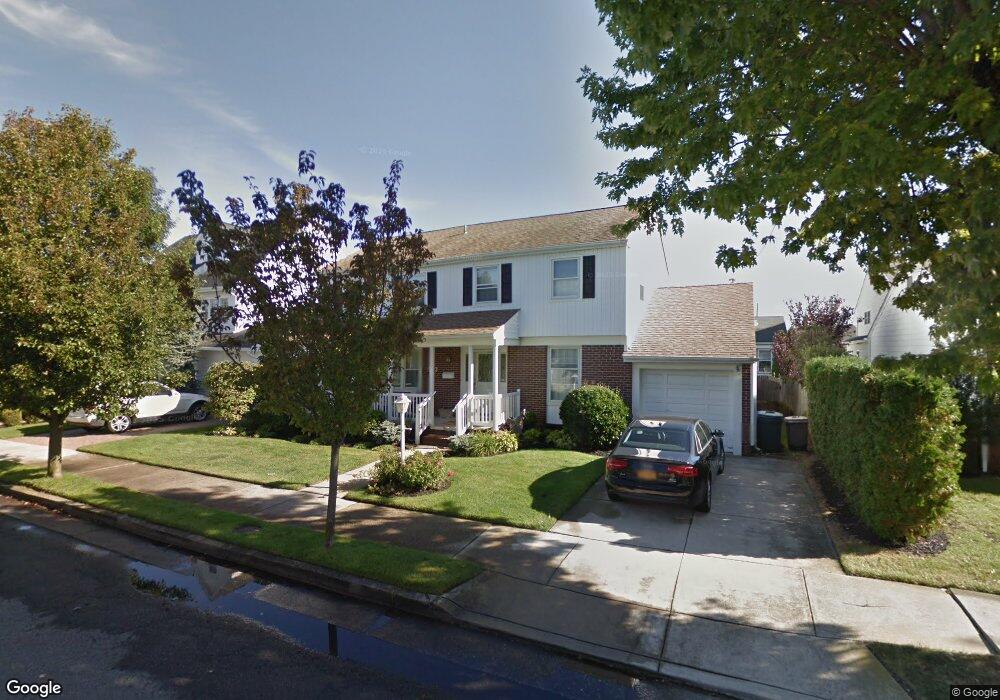
503 N Douglas Ave Margate City, NJ 08402
Estimated Value: $1,043,000 - $1,095,000
--
Bed
--
Bath
2,088
Sq Ft
$515/Sq Ft
Est. Value
About This Home
This home is located at 503 N Douglas Ave, Margate City, NJ 08402 and is currently estimated at $1,074,300, approximately $514 per square foot. 503 N Douglas Ave is a home located in Atlantic County with nearby schools including William H. Ross III Intermediate School, Eugene A. Tighe Middle School, and Blessed Sacrament Regional School.
Ownership History
Date
Name
Owned For
Owner Type
Purchase Details
Closed on
Jun 18, 2021
Sold by
Lilley James D and Sallata Lauren
Bought by
Blumberg L Michael
Current Estimated Value
Home Financials for this Owner
Home Financials are based on the most recent Mortgage that was taken out on this home.
Original Mortgage
$460,000
Outstanding Balance
$416,473
Interest Rate
2.9%
Mortgage Type
New Conventional
Estimated Equity
$657,827
Purchase Details
Closed on
Jul 11, 2007
Sold by
Zorner Kathleen L
Bought by
Lilley James D and Sallata Lauren
Home Financials for this Owner
Home Financials are based on the most recent Mortgage that was taken out on this home.
Original Mortgage
$290,000
Interest Rate
6.48%
Mortgage Type
New Conventional
Purchase Details
Closed on
Nov 14, 1997
Sold by
Zorner Alan A and Zorner Kathleen L
Bought by
Zorner Kathleen L
Purchase Details
Closed on
May 24, 1993
Sold by
Pearlman Joy
Bought by
Zorner Alan and Zorner Kathleen
Create a Home Valuation Report for This Property
The Home Valuation Report is an in-depth analysis detailing your home's value as well as a comparison with similar homes in the area
Home Values in the Area
Average Home Value in this Area
Purchase History
| Date | Buyer | Sale Price | Title Company |
|---|---|---|---|
| Blumberg L Michael | $660,000 | Agents Title Llc | |
| Lilley James D | $510,000 | Agents Title Services | |
| Zorner Kathleen L | -- | -- | |
| Zorner Alan | $160,000 | -- |
Source: Public Records
Mortgage History
| Date | Status | Borrower | Loan Amount |
|---|---|---|---|
| Open | Blumberg L Michael | $460,000 | |
| Previous Owner | Lilley James D | $290,000 |
Source: Public Records
Tax History Compared to Growth
Tax History
| Year | Tax Paid | Tax Assessment Tax Assessment Total Assessment is a certain percentage of the fair market value that is determined by local assessors to be the total taxable value of land and additions on the property. | Land | Improvement |
|---|---|---|---|---|
| 2025 | $6,482 | $379,500 | $237,400 | $142,100 |
| 2024 | $6,482 | $379,500 | $237,400 | $142,100 |
| 2023 | $5,989 | $379,500 | $237,400 | $142,100 |
| 2022 | $5,989 | $379,500 | $237,400 | $142,100 |
| 2021 | $5,905 | $379,500 | $237,400 | $142,100 |
| 2020 | $5,875 | $379,500 | $237,400 | $142,100 |
| 2019 | $5,852 | $379,500 | $237,400 | $142,100 |
| 2018 | $5,932 | $379,500 | $237,400 | $142,100 |
| 2017 | $5,939 | $379,500 | $237,400 | $142,100 |
| 2016 | $5,738 | $379,500 | $237,400 | $142,100 |
| 2015 | $5,647 | $379,500 | $237,400 | $142,100 |
| 2014 | $5,541 | $379,500 | $237,400 | $142,100 |
Source: Public Records
Map
Nearby Homes
- 507 N Douglas Ave
- 420 N Delavan Ave
- 7605 Wellington Ave
- 426 N Exeter Ave
- 614 N Delavan Ave
- 411 N Douglas Ave
- 8110 Marshall Ave
- 7510 Fremont Ave
- 312 N Gladstone Ave
- 7504 Fremont Ave
- 8010 Lagoon Dr
- 323 N Huntington Ave
- 1 Seaside Ct
- 7403 Bayshore Dr
- 403 Oak Terrace
- 221 N Delavan Ave
- 222 N Delavan Ave
- 8 Seaside Ct
- 6 Bayside Ct
- 8 S Colmar Cir
- 505 N Douglas Ave
- 502 N Delavan Ave
- 501 N Douglas Ave
- 504 N Delavan Ave
- 500 N Delavan Ave
- 502 N Douglas Ave
- 504 N Douglas Ave
- 500 N Douglas Ave
- 506 N Delavan Ave
- 506 N Douglas Ave
- 509 N Douglas Ave
- 503 N Delavan Ave
- 2 Essex Ct
- 9720 509 N Douglas Ave
- 427 N Douglas Ave
- 508 N Delavan Ave
- 501 N Delavan Ave
- 1 Essex Ct
- 3 Essex Ct
- 422 N Delavan Ave