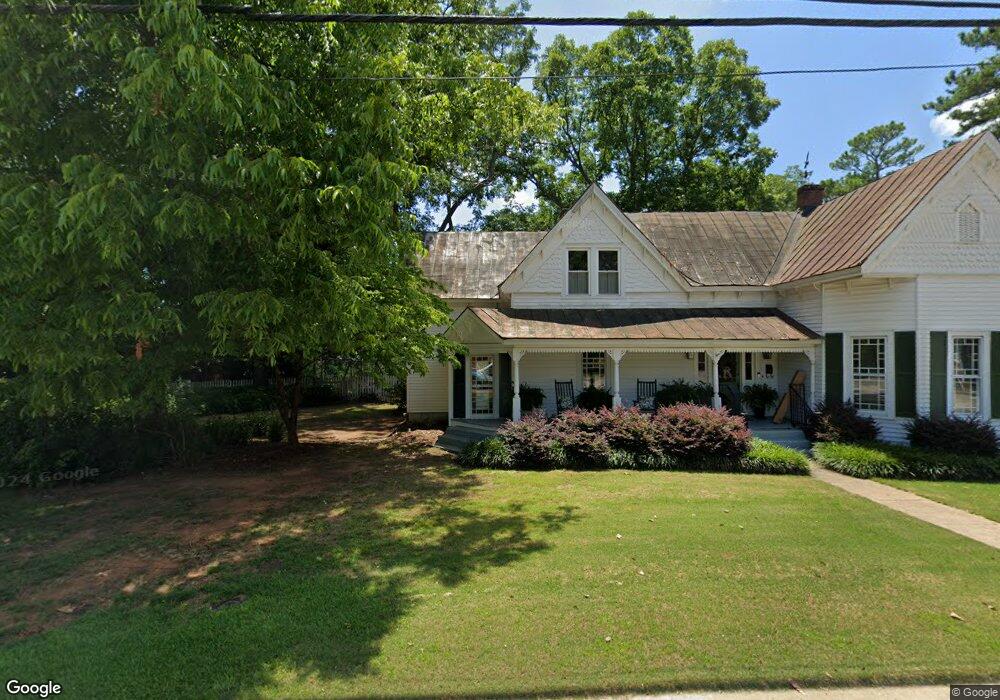
503 N Main St Fountain Inn, SC 29644
Estimated Value: $440,000 - $751,000
5
Beds
3
Baths
2,187
Sq Ft
$243/Sq Ft
Est. Value
About This Home
This home is located at 503 N Main St, Fountain Inn, SC 29644 and is currently estimated at $531,897, approximately $243 per square foot. 503 N Main St is a home located in Greenville County with nearby schools including Fountain Inn Elementary School, Bryson Middle School, and Fountain Inn Christian School.
Ownership History
Date
Name
Owned For
Owner Type
Purchase Details
Closed on
Jul 31, 2020
Sold by
Timanus Carol A
Bought by
Nichols William Brett and Nichols Mary Elise
Current Estimated Value
Home Financials for this Owner
Home Financials are based on the most recent Mortgage that was taken out on this home.
Original Mortgage
$320,000
Outstanding Balance
$284,387
Interest Rate
3.1%
Mortgage Type
New Conventional
Estimated Equity
$247,510
Purchase Details
Closed on
Jun 12, 2020
Sold by
Timanus Carol A and Estate Of Edwin Clay Timanus I
Bought by
Timanus Carol A
Home Financials for this Owner
Home Financials are based on the most recent Mortgage that was taken out on this home.
Original Mortgage
$320,000
Outstanding Balance
$284,387
Interest Rate
3.1%
Mortgage Type
New Conventional
Estimated Equity
$247,510
Purchase Details
Closed on
Apr 25, 2016
Sold by
Edwin Clay Timanus
Bought by
Brady Corey
Home Financials for this Owner
Home Financials are based on the most recent Mortgage that was taken out on this home.
Original Mortgage
$68,500
Interest Rate
3.59%
Purchase Details
Closed on
Jul 20, 2015
Sold by
Timanus Edwin Clay and Timanus Carol A
Bought by
Peters Mark B and Peters Melanie L
Create a Home Valuation Report for This Property
The Home Valuation Report is an in-depth analysis detailing your home's value as well as a comparison with similar homes in the area
Home Values in the Area
Average Home Value in this Area
Purchase History
| Date | Buyer | Sale Price | Title Company |
|---|---|---|---|
| Nichols William Brett | $400,000 | None Available | |
| Timanus Carol A | -- | None Available | |
| Brady Corey | -- | -- | |
| Peters Mark B | $96,000 | -- |
Source: Public Records
Mortgage History
| Date | Status | Borrower | Loan Amount |
|---|---|---|---|
| Open | Nichols William Brett | $320,000 | |
| Previous Owner | Brady Corey | $68,500 | |
| Previous Owner | Brady Corey | -- |
Source: Public Records
Tax History Compared to Growth
Tax History
| Year | Tax Paid | Tax Assessment Tax Assessment Total Assessment is a certain percentage of the fair market value that is determined by local assessors to be the total taxable value of land and additions on the property. | Land | Improvement |
|---|---|---|---|---|
| 2024 | $2,516 | $12,360 | $3,000 | $9,360 |
| 2023 | $2,516 | $12,360 | $3,000 | $9,360 |
| 2022 | $2,459 | $12,360 | $3,000 | $9,360 |
| 2021 | $2,448 | $12,360 | $3,000 | $9,360 |
| 2020 | $1,174 | $4,990 | $1,800 | $3,190 |
| 2019 | $783 | $4,990 | $1,800 | $3,190 |
| 2018 | $781 | $4,990 | $1,800 | $3,190 |
| 2017 | $651 | $4,990 | $1,800 | $3,190 |
| 2016 | $1,005 | $124,740 | $45,000 | $79,740 |
| 2015 | $1,074 | $133,740 | $54,000 | $79,740 |
| 2014 | $1,150 | $147,270 | $54,000 | $93,270 |
Source: Public Records
Map
Nearby Homes
- 121 Parsons St
- 103 Gault St
- 203 Givens St
- 111 Woodvale Ave
- 300 Woodvale Ave
- 402 Front Porch Dr
- 0 N Main St
- 259 Inn Cir
- 105 Belmont Dr
- 201A Belmont Dr
- 100 Cliffwood Ct
- 930 N Main St
- 100 Belmont Dr
- 119A Woodland Dr
- 513 Scarlet Oak Dr
- 125 Patton St
- 416 Scarlet Oak Dr
- Stoneycreek in Aberdeen Plan at Aberdeen
- 139 Hughes St
- 626 Hellams St