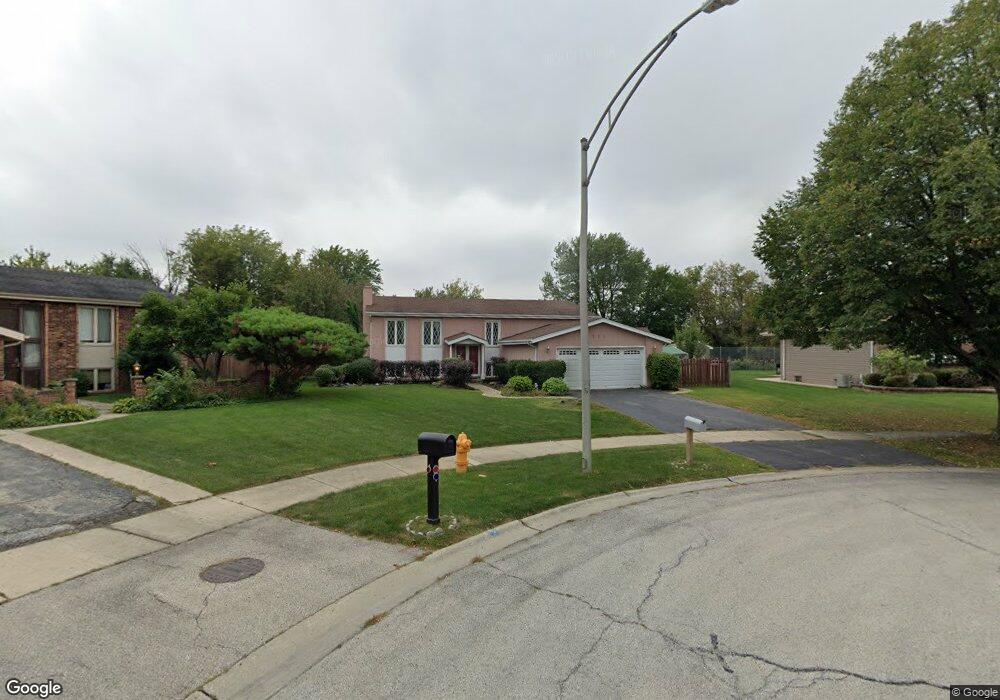
503 N Rumple Ln Addison, IL 60101
Estimated Value: $435,000 - $468,000
3
Beds
2
Baths
2,469
Sq Ft
$183/Sq Ft
Est. Value
About This Home
This home is located at 503 N Rumple Ln, Addison, IL 60101 and is currently estimated at $451,923, approximately $183 per square foot. 503 N Rumple Ln is a home located in DuPage County with nearby schools including Stone Elementary School, Indian Trail Jr High School, and Addison Trail High School.
Ownership History
Date
Name
Owned For
Owner Type
Purchase Details
Closed on
Mar 7, 2017
Sold by
Fannie Mae
Bought by
Lambert Scott
Current Estimated Value
Home Financials for this Owner
Home Financials are based on the most recent Mortgage that was taken out on this home.
Original Mortgage
$245,471
Outstanding Balance
$201,838
Interest Rate
3.87%
Mortgage Type
FHA
Estimated Equity
$250,085
Purchase Details
Closed on
Feb 23, 2016
Sold by
Levant Gregory D
Bought by
Federal National Mortgage Association
Purchase Details
Closed on
Jan 11, 2002
Sold by
Hasapis John A and Hasapis Eleni
Bought by
Levant Gregory D
Home Financials for this Owner
Home Financials are based on the most recent Mortgage that was taken out on this home.
Original Mortgage
$200,000
Interest Rate
7.26%
Create a Home Valuation Report for This Property
The Home Valuation Report is an in-depth analysis detailing your home's value as well as a comparison with similar homes in the area
Home Values in the Area
Average Home Value in this Area
Purchase History
| Date | Buyer | Sale Price | Title Company |
|---|---|---|---|
| Lambert Scott | $250,000 | Attorneys Title Guaranty Fun | |
| Federal National Mortgage Association | -- | Attorney | |
| Levant Gregory D | $222,500 | -- |
Source: Public Records
Mortgage History
| Date | Status | Borrower | Loan Amount |
|---|---|---|---|
| Open | Lambert Scott | $245,471 | |
| Previous Owner | Levant Gregory D | $200,000 |
Source: Public Records
Tax History Compared to Growth
Tax History
| Year | Tax Paid | Tax Assessment Tax Assessment Total Assessment is a certain percentage of the fair market value that is determined by local assessors to be the total taxable value of land and additions on the property. | Land | Improvement |
|---|---|---|---|---|
| 2024 | $9,543 | $144,102 | $36,086 | $108,016 |
| 2023 | $9,064 | $131,780 | $33,000 | $98,780 |
| 2022 | $8,238 | $117,760 | $32,790 | $84,970 |
| 2021 | $7,828 | $111,880 | $31,150 | $80,730 |
| 2020 | $7,758 | $109,150 | $30,390 | $78,760 |
| 2019 | $7,726 | $104,890 | $29,200 | $75,690 |
| 2018 | $8,874 | $114,930 | $28,440 | $86,490 |
| 2017 | $8,387 | $106,520 | $26,360 | $80,160 |
| 2016 | $8,173 | $98,590 | $24,400 | $74,190 |
| 2015 | $8,065 | $92,000 | $22,770 | $69,230 |
| 2014 | $7,831 | $88,850 | $21,990 | $66,860 |
| 2013 | $7,782 | $91,890 | $22,740 | $69,150 |
Source: Public Records
Map
Nearby Homes
- 20W561 Army Trail Blvd
- 1750 W Woodland Ave
- 818 N Rumple Ln
- 1527 W Holtz Ave
- 823 N Harrow Ct
- 580 N Highlander Way
- 180 N Prairie Dr
- 941 N Swift Rd Unit 301
- 881 N Swift Rd Unit 206
- 943 N Rohlwing Rd Unit 101H
- 231 N Flora Pkwy
- 953 N Rohlwing Rd Unit GB
- 1155 W Westwood Trail
- 19W720 Woodland Ave
- +/-1.51 Acres Lake St
- 1275 W Lake St Unit 104
- 22W070 Byron Ave
- 2164 W Concord Ln
- 2129 W Concord Ln
- 1210 N Foxdale Dr Unit 109
- 501 N Rumple Ln
- 505 N Rumple Ln
- 1821 W Sherry Ln
- 507 N Rumple Ln
- 1823 W Sherry Ln
- 509 N Rumple Ln
- 511 N Rumple Ln
- 4N030 Rohlwing Rd
- 510 N Rumple Ln
- 1820 W Sherry Ln
- 515 N Rumple Ln
- 1824 W Sherry Ln
- 516 N Rumple Ln Unit 3
- 1828 W Sherry Ln
- 1831 W Sherry Ln
- 520 N Rumple Ln
- 515 N Kenmore Ave
- 519 N Rumple Ln
- 1835 W Sherry Ln
- 521 N Rumple Ln