Estimated Value: $255,000 - $278,000
3
Beds
2
Baths
1,882
Sq Ft
$143/Sq Ft
Est. Value
About This Home
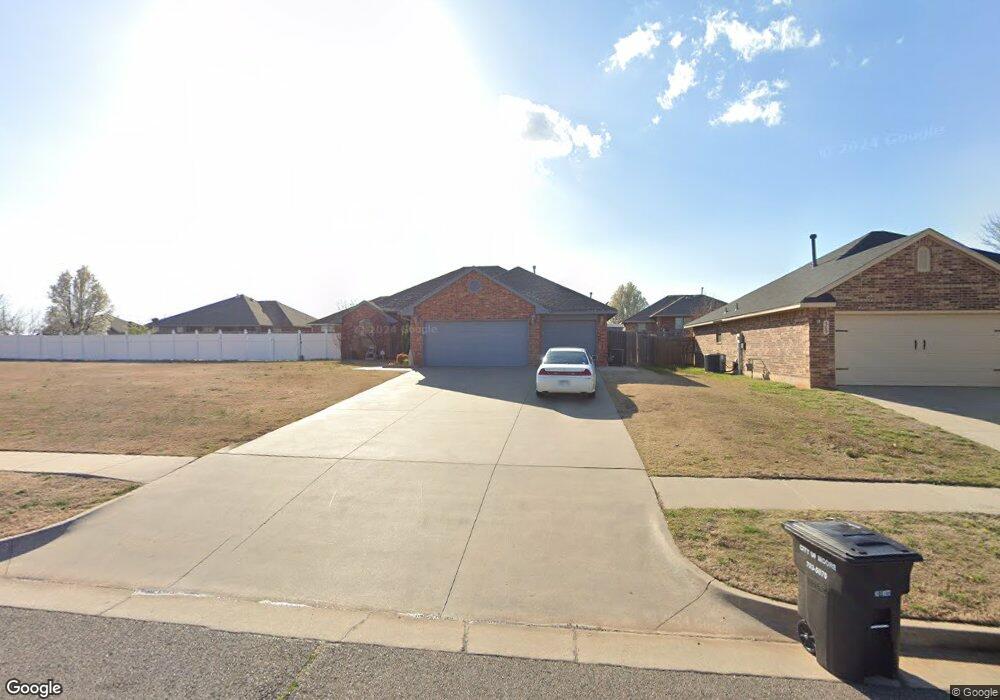
This home is located at 503 Nathan Ln, Moore, OK 73160 and is currently estimated at $269,538, approximately $143 per square foot. 503 Nathan Ln is a home located in Cleveland County with nearby schools including Heritage Trails Elementary School, Highland East Junior High School, and Moore High School.
Ownership History
Date
Name
Owned For
Owner Type
Purchase Details
Closed on
Dec 29, 2016
Sold by
Smith Richard A and Smith Susan E
Bought by
The Richard A Smith And Susan E Smith Li
Current Estimated Value
Purchase Details
Closed on
Feb 20, 2013
Sold by
Smith Susan and Walls Susan
Bought by
Smith Richard A and Smith Susan
Purchase Details
Closed on
May 28, 2008
Sold by
Coffey Patrick D and Coffey Terry Ann
Bought by
Smith Richard A
Home Financials for this Owner
Home Financials are based on the most recent Mortgage that was taken out on this home.
Original Mortgage
$161,349
Interest Rate
5.89%
Mortgage Type
FHA
Purchase Details
Closed on
Feb 20, 2004
Sold by
Purchasers Investments, Inc
Bought by
Coffey Patrick D
Create a Home Valuation Report for This Property
The Home Valuation Report is an in-depth analysis detailing your home's value as well as a comparison with similar homes in the area
Home Values in the Area
Average Home Value in this Area
Purchase History
| Date | Buyer | Sale Price | Title Company |
|---|---|---|---|
| The Richard A Smith And Susan E Smith Li | -- | None Available | |
| Smith Richard A | -- | None Available | |
| Smith Richard A | $163,500 | None Available | |
| Coffey Patrick D | $150,000 | -- |
Source: Public Records
Mortgage History
| Date | Status | Borrower | Loan Amount |
|---|---|---|---|
| Previous Owner | Smith Richard A | $161,349 |
Source: Public Records
Tax History
| Year | Tax Paid | Tax Assessment Tax Assessment Total Assessment is a certain percentage of the fair market value that is determined by local assessors to be the total taxable value of land and additions on the property. | Land | Improvement |
|---|---|---|---|---|
| 2025 | $3,247 | $26,515 | $6,118 | $20,397 |
| 2024 | $3,063 | $25,252 | $5,922 | $19,330 |
| 2023 | $2,932 | $24,050 | $5,803 | $18,247 |
| 2022 | $2,833 | $22,905 | $4,443 | $18,462 |
| 2021 | $2,711 | $21,814 | $4,341 | $17,473 |
| 2020 | $2,583 | $20,775 | $4,491 | $16,284 |
| 2019 | $2,504 | $19,786 | $2,400 | $17,386 |
| 2018 | $2,505 | $19,786 | $2,400 | $17,386 |
| 2017 | $2,519 | $19,786 | $0 | $0 |
| 2016 | $2,536 | $19,786 | $2,400 | $17,386 |
| 2015 | $2,269 | $19,562 | $1,980 | $17,582 |
| 2014 | $2,285 | $19,241 | $1,980 | $17,261 |
Source: Public Records
Map
Nearby Homes
- 930 Estell Dr
- 1805 SE 1st St
- 112 Wellington Ln
- 105 S Olde Bridge Rd
- 1824 NE 11th St
- 1809 Parkway Dr
- 401 S Bryant Ave
- 1521 NE 1st St
- 1013 Oak Creek Dr
- 1105 Oak Creek Dr
- 2304 SE 5th St
- 1317 Washington Cir
- 625 Champion Ln
- 1320 Sonoma Lakes Blvd
- 605 Kelsi Dr
- 517 Cottonwood Dr
- 2113 SE 8th St
- 1101 Bronze Medal Rd
- 1401 NE 11th St
- 2636 SE 5th St
Your Personal Tour Guide
Ask me questions while you tour the home.