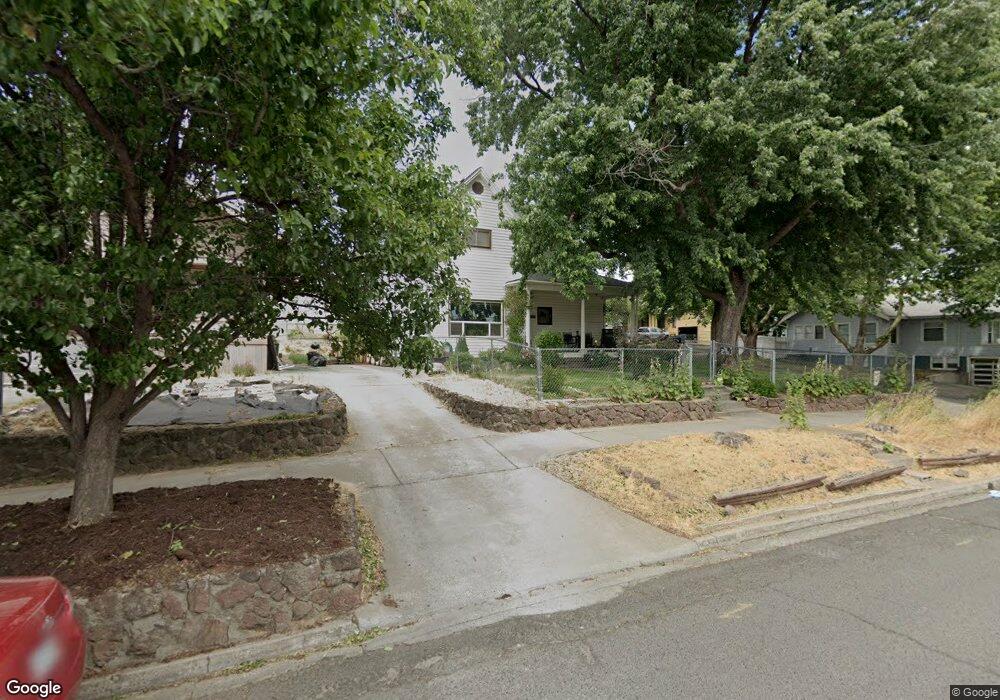
503 NW Furnish Ave Pendleton, OR 97801
Estimated Value: $238,000 - $267,170
3
Beds
2
Baths
1,269
Sq Ft
$197/Sq Ft
Est. Value
About This Home
This home is located at 503 NW Furnish Ave, Pendleton, OR 97801 and is currently estimated at $249,543, approximately $196 per square foot. 503 NW Furnish Ave is a home located in Umatilla County with nearby schools including Washington Elementary School, Sunridge Middle School, and Pendleton High School.
Ownership History
Date
Name
Owned For
Owner Type
Purchase Details
Closed on
Dec 1, 2016
Sold by
Knights Gary L
Bought by
Smootz Eric
Current Estimated Value
Home Financials for this Owner
Home Financials are based on the most recent Mortgage that was taken out on this home.
Original Mortgage
$118,787
Outstanding Balance
$95,918
Interest Rate
3.52%
Mortgage Type
New Conventional
Estimated Equity
$153,625
Purchase Details
Closed on
Nov 30, 2016
Sold by
Schuening Marion and Knights Michael
Bought by
Smootz Eric
Home Financials for this Owner
Home Financials are based on the most recent Mortgage that was taken out on this home.
Original Mortgage
$118,787
Outstanding Balance
$95,918
Interest Rate
3.52%
Mortgage Type
New Conventional
Estimated Equity
$153,625
Create a Home Valuation Report for This Property
The Home Valuation Report is an in-depth analysis detailing your home's value as well as a comparison with similar homes in the area
Home Values in the Area
Average Home Value in this Area
Purchase History
| Date | Buyer | Sale Price | Title Company |
|---|---|---|---|
| Smootz Eric | $28,750 | Amerititle | |
| Smootz Eric | $115,000 | Amerititle |
Source: Public Records
Mortgage History
| Date | Status | Borrower | Loan Amount |
|---|---|---|---|
| Open | Smootz Eric | $118,787 |
Source: Public Records
Tax History Compared to Growth
Tax History
| Year | Tax Paid | Tax Assessment Tax Assessment Total Assessment is a certain percentage of the fair market value that is determined by local assessors to be the total taxable value of land and additions on the property. | Land | Improvement |
|---|---|---|---|---|
| 2024 | $2,291 | $123,710 | $39,070 | $84,640 |
| 2023 | $2,236 | $120,110 | $37,930 | $82,180 |
| 2022 | $2,109 | $116,620 | $0 | $0 |
| 2021 | $2,122 | $113,230 | $35,750 | $77,480 |
| 2020 | $2,049 | $109,940 | $34,710 | $75,230 |
| 2018 | $1,991 | $103,640 | $32,720 | $70,920 |
| 2017 | $1,944 | $100,630 | $31,760 | $68,870 |
| 2016 | $1,837 | $97,700 | $30,840 | $66,860 |
| 2015 | $1,837 | $89,420 | $28,220 | $61,200 |
| 2014 | $1,759 | $89,420 | $28,220 | $61,200 |
Source: Public Records
Map
Nearby Homes
- 501 NW 6th St
- 712 NW 6th St
- 415 N Main St
- 0 N Main St
- 315 NW 8th St
- 706 NW 3rd Dr
- 628 N Main St
- 913 NW Ellis Ave
- 722 N Main St
- 732 N Main St
- 510 NW 11th St
- 401 NW Bailey Ave
- 736 N Main St
- 740 N Main St
- 744 N Main St
- 802 N Main St
- 311 NW 11th St
- 1003 NW Carden Ave
- 1214 NW Furnish Place
- 607 SW Court Ave