Estimated Value: $149,026 - $199,000
3
Beds
1
Bath
1,152
Sq Ft
$155/Sq Ft
Est. Value
About This Home
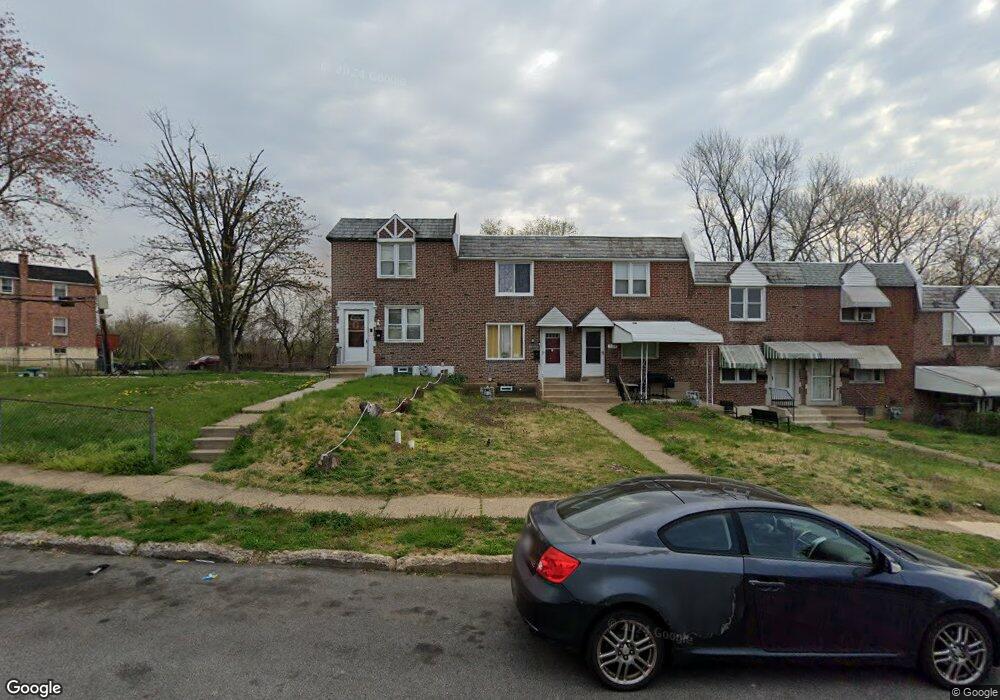
This home is located at 503 S 2nd St, Darby, PA 19023 and is currently estimated at $178,507, approximately $154 per square foot. 503 S 2nd St is a home located in Delaware County with nearby schools including Colwyn Elementary School, Penn Wood Middle School, and Penn Wood High School - Cypress Street Campus.
Ownership History
Date
Name
Owned For
Owner Type
Purchase Details
Closed on
Aug 31, 2021
Sold by
Justbcuz Llc
Bought by
George Ruth H
Current Estimated Value
Home Financials for this Owner
Home Financials are based on the most recent Mortgage that was taken out on this home.
Original Mortgage
$111,550
Outstanding Balance
$101,502
Interest Rate
2.8%
Mortgage Type
New Conventional
Estimated Equity
$77,005
Purchase Details
Closed on
Nov 2, 2017
Sold by
Usa Regrowth Fund Llc
Bought by
Justbcuz Llc
Home Financials for this Owner
Home Financials are based on the most recent Mortgage that was taken out on this home.
Original Mortgage
$46,800
Interest Rate
3.83%
Mortgage Type
New Conventional
Purchase Details
Closed on
Jul 19, 2017
Sold by
Pascucci Paul J
Bought by
Usa Regrowth Fund Llc
Purchase Details
Closed on
Jun 21, 1973
Bought by
Pascucci Paul and Pascucci Carol R
Create a Home Valuation Report for This Property
The Home Valuation Report is an in-depth analysis detailing your home's value as well as a comparison with similar homes in the area
Home Values in the Area
Average Home Value in this Area
Purchase History
| Date | Buyer | Sale Price | Title Company |
|---|---|---|---|
| George Ruth H | $115,000 | Chesco Settlements Llc | |
| Justbcuz Llc | $42,300 | Horizon Abstract Company Inc | |
| Usa Regrowth Fund Llc | $35,000 | None Available | |
| Pascucci Paul | -- | -- |
Source: Public Records
Mortgage History
| Date | Status | Borrower | Loan Amount |
|---|---|---|---|
| Open | George Ruth H | $111,550 | |
| Previous Owner | Justbcuz Llc | $46,800 |
Source: Public Records
Tax History
| Year | Tax Paid | Tax Assessment Tax Assessment Total Assessment is a certain percentage of the fair market value that is determined by local assessors to be the total taxable value of land and additions on the property. | Land | Improvement |
|---|---|---|---|---|
| 2025 | $3,128 | $60,080 | $12,570 | $47,510 |
| 2024 | $3,128 | $60,080 | $12,570 | $47,510 |
| 2023 | $1,920 | $60,080 | $12,570 | $47,510 |
| 2022 | $2,967 | $60,080 | $12,570 | $47,510 |
| 2021 | $4,103 | $60,080 | $12,570 | $47,510 |
| 2020 | $4,378 | $56,300 | $17,380 | $38,920 |
| 2019 | $4,316 | $56,300 | $17,380 | $38,920 |
| 2018 | $4,268 | $56,300 | $0 | $0 |
| 2017 | $4,197 | $56,300 | $0 | $0 |
| 2016 | $309 | $56,300 | $0 | $0 |
| 2015 | $309 | $56,300 | $0 | $0 |
| 2014 | $315 | $56,300 | $0 | $0 |
Source: Public Records
Map
Nearby Homes
Your Personal Tour Guide
Ask me questions while you tour the home.