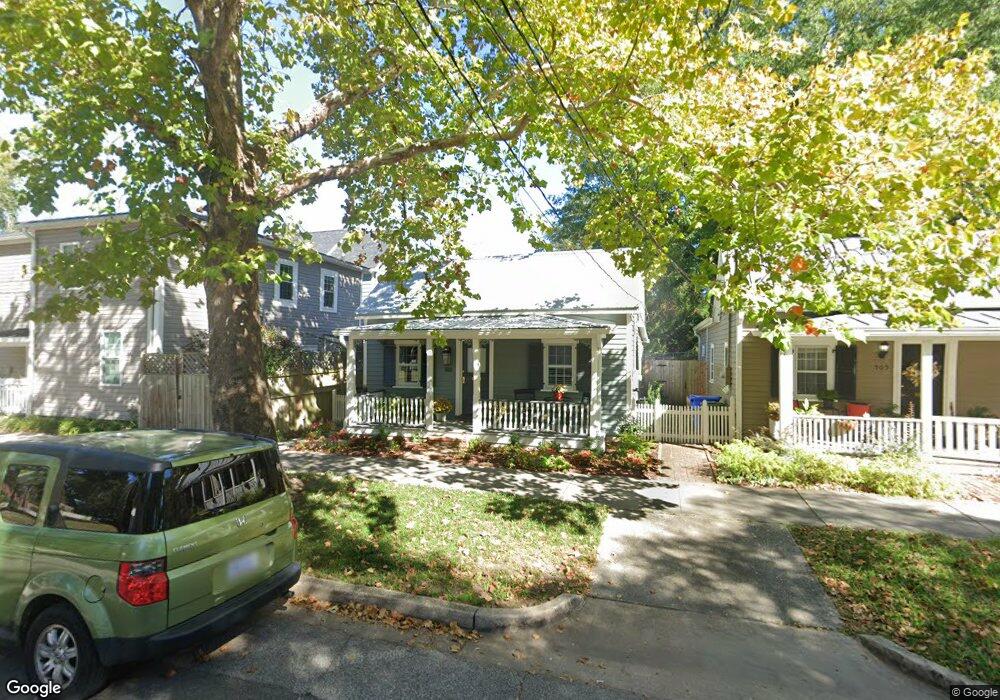
503 S 6th St Wilmington, NC 28401
Old Wilmington NeighborhoodEstimated Value: $274,535 - $314,000
2
Beds
1
Bath
748
Sq Ft
$388/Sq Ft
Est. Value
About This Home
This home is located at 503 S 6th St, Wilmington, NC 28401 and is currently estimated at $289,884, approximately $387 per square foot. 503 S 6th St is a home located in New Hanover County with nearby schools including Snipes Academy of Arts & Design, Williston Middle School, and New Hanover High School.
Ownership History
Date
Name
Owned For
Owner Type
Purchase Details
Closed on
Nov 12, 2024
Sold by
Richardson Thomas K
Bought by
Landen Mary L
Current Estimated Value
Purchase Details
Closed on
Jan 1, 1986
Sold by
Richardson Marion E
Bought by
Richardson Marion E
Purchase Details
Closed on
May 1, 1983
Sold by
Rice Arthur Florida
Bought by
Richardson Marion E
Purchase Details
Closed on
May 1, 1980
Bought by
Rice Arthur Florida
Create a Home Valuation Report for This Property
The Home Valuation Report is an in-depth analysis detailing your home's value as well as a comparison with similar homes in the area
Home Values in the Area
Average Home Value in this Area
Purchase History
| Date | Buyer | Sale Price | Title Company |
|---|---|---|---|
| Landen Mary L | $290,000 | None Listed On Document | |
| Landen Mary L | $290,000 | None Listed On Document | |
| Richardson Marion E | $10,000 | -- | |
| Richardson Marion E | $8,500 | -- | |
| Rice Arthur Florida | $2,000 | -- |
Source: Public Records
Tax History Compared to Growth
Tax History
| Year | Tax Paid | Tax Assessment Tax Assessment Total Assessment is a certain percentage of the fair market value that is determined by local assessors to be the total taxable value of land and additions on the property. | Land | Improvement |
|---|---|---|---|---|
| 2025 | -- | $260,200 | $74,300 | $185,900 |
| 2024 | -- | $124,400 | $43,400 | $81,000 |
| 2023 | $1,057 | $124,400 | $43,400 | $81,000 |
| 2022 | $1,057 | $124,400 | $43,400 | $81,000 |
| 2021 | $1,065 | $124,400 | $43,400 | $81,000 |
| 2020 | $863 | $81,900 | $38,800 | $43,100 |
| 2019 | $863 | $81,900 | $38,800 | $43,100 |
| 2018 | $863 | $81,900 | $38,800 | $43,100 |
| 2017 | $863 | $81,900 | $38,800 | $43,100 |
| 2016 | $920 | $83,000 | $42,700 | $40,300 |
| 2015 | $879 | $83,000 | $42,700 | $40,300 |
| 2014 | $842 | $83,000 | $42,700 | $40,300 |
Source: Public Records
Map
Nearby Homes