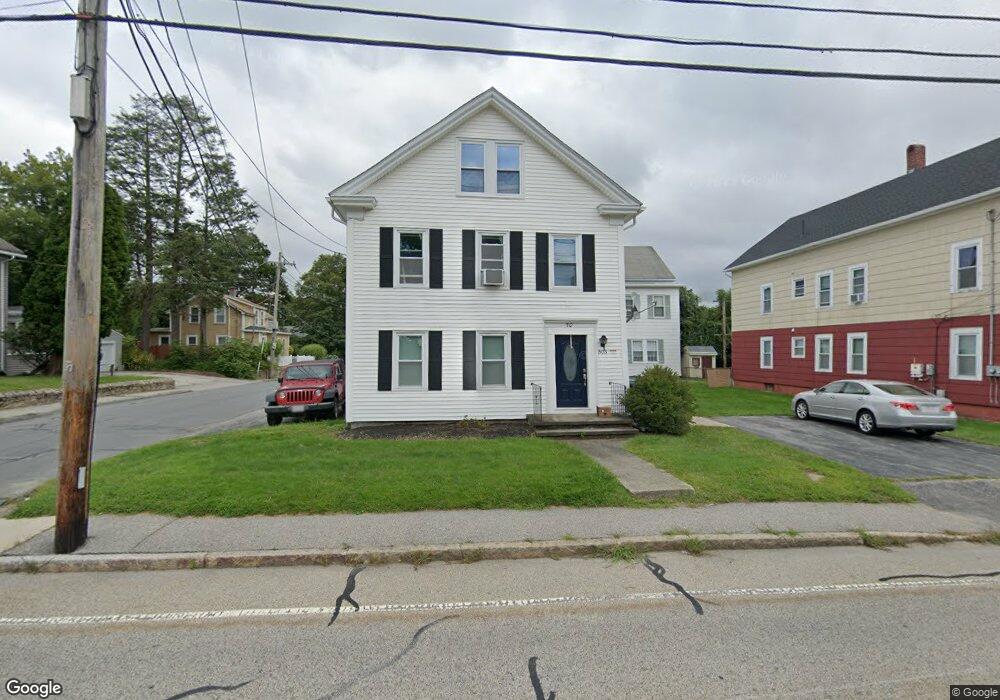
503 School St Webster, MA 01570
Estimated Value: $349,000 - $500,000
4
Beds
2
Baths
1,988
Sq Ft
$201/Sq Ft
Est. Value
About This Home
This home is located at 503 School St, Webster, MA 01570 and is currently estimated at $399,165, approximately $200 per square foot. 503 School St is a home located in Worcester County with nearby schools including Park Avenue Elementary School, Webster Middle School, and Bartlett High School.
Ownership History
Date
Name
Owned For
Owner Type
Purchase Details
Closed on
Feb 10, 2016
Sold by
Lepage William P
Bought by
Savy Properties Llc
Current Estimated Value
Purchase Details
Closed on
Jul 20, 2012
Sold by
Kapurch Emma M
Bought by
Kapurch Susan M
Purchase Details
Closed on
Mar 18, 2010
Sold by
Vigeant Cecelia Est
Bought by
Kapurch Emma M
Create a Home Valuation Report for This Property
The Home Valuation Report is an in-depth analysis detailing your home's value as well as a comparison with similar homes in the area
Home Values in the Area
Average Home Value in this Area
Purchase History
| Date | Buyer | Sale Price | Title Company |
|---|---|---|---|
| Savy Properties Llc | -- | -- | |
| Kapurch Susan M | -- | -- | |
| Kapurch Emma M | $110,000 | -- |
Source: Public Records
Tax History
| Year | Tax Paid | Tax Assessment Tax Assessment Total Assessment is a certain percentage of the fair market value that is determined by local assessors to be the total taxable value of land and additions on the property. | Land | Improvement |
|---|---|---|---|---|
| 2025 | $3,250 | $273,600 | $48,700 | $224,900 |
| 2024 | $3,119 | $256,100 | $46,900 | $209,200 |
| 2023 | $2,674 | $213,900 | $44,600 | $169,300 |
| 2022 | $2,602 | $186,400 | $43,300 | $143,100 |
| 2021 | $2,499 | $165,500 | $43,300 | $122,200 |
| 2020 | $2,322 | $154,200 | $43,300 | $110,900 |
| 2019 | $2,307 | $150,500 | $43,300 | $107,200 |
| 2018 | $1,996 | $129,700 | $43,300 | $86,400 |
| 2017 | $1,906 | $126,000 | $42,400 | $83,600 |
| 2016 | $1,908 | $126,000 | $42,400 | $83,600 |
Source: Public Records
Map
Nearby Homes
Your Personal Tour Guide
Ask me questions while you tour the home.