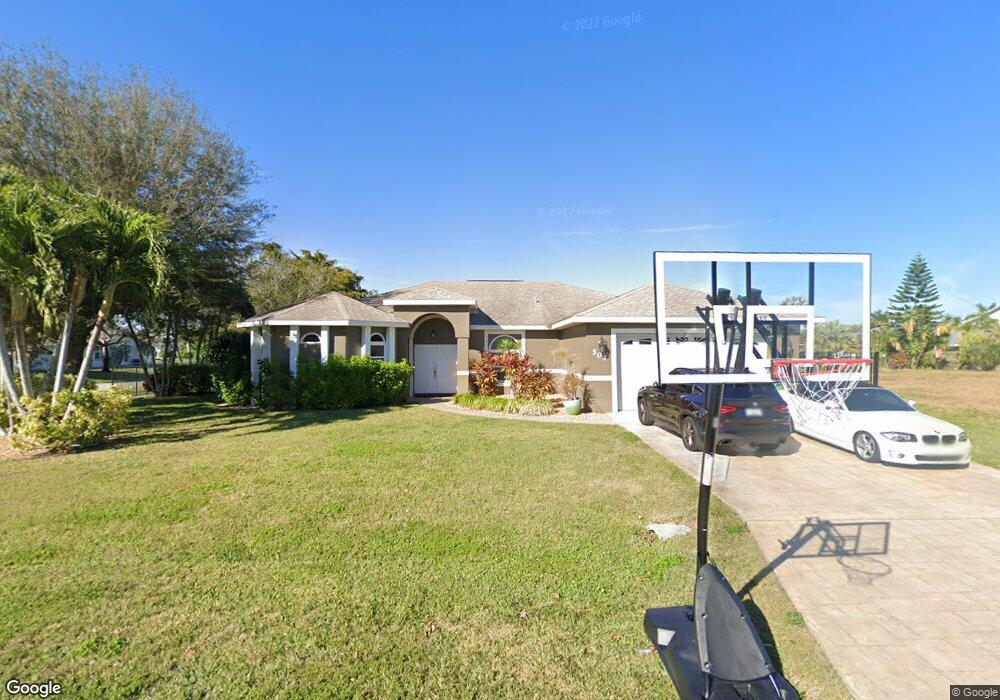
503 SE 32nd Terrace Unit 15 Cape Coral, FL 33904
Caloosahatchee NeighborhoodEstimated Value: $478,314 - $587,000
4
Beds
2
Baths
3,263
Sq Ft
$159/Sq Ft
Est. Value
About This Home
This home is located at 503 SE 32nd Terrace Unit 15, Cape Coral, FL 33904 and is currently estimated at $519,829, approximately $159 per square foot. 503 SE 32nd Terrace Unit 15 is a home located in Lee County with nearby schools including Cape Elementary School, Caloosa Elementary School, and Tropic Isles Elementary School.
Ownership History
Date
Name
Owned For
Owner Type
Purchase Details
Closed on
Nov 18, 2011
Sold by
Federal Home Loan Mortgage Corporation
Bought by
Caudill Sarah E and Caudill Derek R
Current Estimated Value
Home Financials for this Owner
Home Financials are based on the most recent Mortgage that was taken out on this home.
Original Mortgage
$162,668
Outstanding Balance
$115,371
Interest Rate
4.87%
Mortgage Type
FHA
Estimated Equity
$404,458
Purchase Details
Closed on
Aug 19, 2011
Sold by
Ocwen Loan Servicing Llc
Bought by
Federal Home Loan Mortgage Corp
Purchase Details
Closed on
Aug 9, 2011
Sold by
Panzica Louis J
Bought by
Ocwen Loan Servicing Llc
Purchase Details
Closed on
Mar 1, 2002
Sold by
Carbone Robin J and Carbone Teresa A
Bought by
Panzica Louis J and Panzica Joann L
Create a Home Valuation Report for This Property
The Home Valuation Report is an in-depth analysis detailing your home's value as well as a comparison with similar homes in the area
Home Values in the Area
Average Home Value in this Area
Purchase History
| Date | Buyer | Sale Price | Title Company |
|---|---|---|---|
| Caudill Sarah E | $166,900 | New House Title | |
| Federal Home Loan Mortgage Corp | -- | New House Title | |
| Ocwen Loan Servicing Llc | $146,900 | None Available | |
| Panzica Louis J | $17,000 | -- |
Source: Public Records
Mortgage History
| Date | Status | Borrower | Loan Amount |
|---|---|---|---|
| Open | Caudill Sarah E | $162,668 |
Source: Public Records
Tax History Compared to Growth
Tax History
| Year | Tax Paid | Tax Assessment Tax Assessment Total Assessment is a certain percentage of the fair market value that is determined by local assessors to be the total taxable value of land and additions on the property. | Land | Improvement |
|---|---|---|---|---|
| 2025 | $4,040 | $241,587 | -- | -- |
| 2024 | $3,885 | $234,778 | -- | -- |
| 2023 | $3,885 | $227,940 | $0 | $0 |
| 2022 | $3,616 | $221,301 | $0 | $0 |
| 2021 | $3,689 | $317,543 | $35,523 | $282,020 |
| 2020 | $3,532 | $200,525 | $0 | $0 |
| 2019 | $3,427 | $196,017 | $0 | $0 |
| 2018 | $3,416 | $192,362 | $0 | $0 |
| 2017 | $3,396 | $188,405 | $0 | $0 |
| 2016 | $3,318 | $238,274 | $20,274 | $218,000 |
| 2015 | $3,338 | $214,695 | $15,548 | $199,147 |
| 2014 | $3,453 | $205,519 | $13,945 | $191,574 |
| 2013 | -- | $179,106 | $10,919 | $168,187 |
Source: Public Records
Map
Nearby Homes
- 3208 SE 5th Ave
- 3211 SE 4th Place
- 3928 SE 4th Ave
- 502 SE 31st St
- 3401 SE 4th Place
- 418 SE 31st St
- 407 SE 34th Terrace
- 604 SE 31st Terrace
- 3420 SE 5th Place
- 317 SE 32nd Terrace
- 313 SE 31st Terrace
- 3021 SE 5th Ave
- 321 SE 31st St
- 601 SE 31st St
- 3014 SE 6th Ave
- 3006 SE 6th Ave
- 3137 SE 8th Ave
- 318 SE 33rd Terrace
- 244 SE 30th Terrace
- 302 SE 34th St Unit 26
- 509 SE 32nd Terrace
- 507 SE 32nd Terrace
- 502 SE 32nd St
- 506 SE 32nd St
- 502 SE 32nd Terrace
- 506 SE 32nd Terrace
- 430 SE 32nd St
- 510 SE 32nd St
- 3216 SE 5th Ave
- 510 SE 32nd Terrace
- 515 SE 32nd Terrace
- 3220 SE 5th Ave Unit 10
- 514 SE 32nd St Unit 15
- 514 SE 32nd Terrace
- 511 SE 33rd St
- 424 SE 32nd St
- 503 SE 32nd St
- 515 SE 33rd St
- 435 SE 32nd St
- 519 SE 33rd St